
The Starving Artist - Contributed by John Slauson
One of the biggest challenges in developing a trading systems is being precise when defining the rules. Technical analysis is often criticized because many of its adherents are so ambiguous with their methodology. So ambiguous in fact that it becomes impossible to validate their “system” using any semblance of scientific methods. This is convenient for the trading system peddler, but frustrating for the trader. Among technicians, the well worn adage “the trend is your friend” is sadly second only to “technical analysis is an art not a science.” The latter is a euphemism for: “I have a system that works super awesome...except when it doesn’t.”
Some examples of ambiguous trading rules I often hear:
Prices should move slightly above….
Volatility can increase a bit….
Place the stop just above a recent high…
Prices should cross above the moving average on big volume...
Prices will reverse at about the same price level several times…
The trend must be steeply up over the short-term…
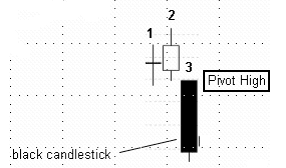
The black candlestick must be significantly larger than the preceding white candlestick…
To move technical analysis out of the realm of art and into the realm of science, ambiguous words like the ones in bolded italics must be eliminated and replaced with precise, quantifiable values.
Of all the tools used by technicians, support and resistance is perhaps the most difficult to quantify. Ask 10 traders to draw support and resistance lines on the same chart and you’ll see lines drawn at almost every price level Years ago I developed a scoring method to help traders quantify support and resistance levels. I presented this method at a conference sponsored by Golden Gate University. In attendance was W.H.C. Bassetti, editor and coauthor of the classic book, Technical Analysis of Stock Trends first written by Robert D. Edwards and John Magee in 1948. Bassetti referenced my scoring method and the MetaStock Add-on based on it (PowerStrike), in the 9th edition of his book.
The methodology I presented for measuring support and resistance is based on three phenomenon in the stock market:
1. Humans prefer “easily” divisible and memorable numbers (e.g.,
“20” is preferred over “19”). These values are typical of option
strike prices. Hence many traders' attention is drawn to these
numbers providing the potential for even more "concentrated"
buying and selling.
2. Stock prices are heavily influenced by trading near option strike
price levels. Hence, these levels greatly influence where
"important" buying and selling occur. Support and resistance is
based on the concentrated buying and selling. Option Strike
Price levels attract more attention from important market
participants over other price levels.
3. Bullish and Bearish pressures at Option Strike Price levels
resolve more quickly than pressures at other levels.
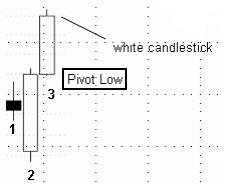
With these general principles in mind, I developed a tool that scored the strength of support and resistance on optionable US stocks. The heart of the scoring method revolves around three bar pivot highs and three bar pivot lows. A value of 1, 3 o 5 points is assigned to a pivot high or low based on the volume associated with bars 1 and 3 of the pattern.
To be counted in the score a pivot highs or lows has to form within a specified distance (based on precise volatility bands) from an option strike price. Totaling these values provides a specific score for the support or resistance level being measured. The score can then easily be used independently or incorporated into a larger set of trading rules. It can even be backtested, an important litmus test for a valid trading method.
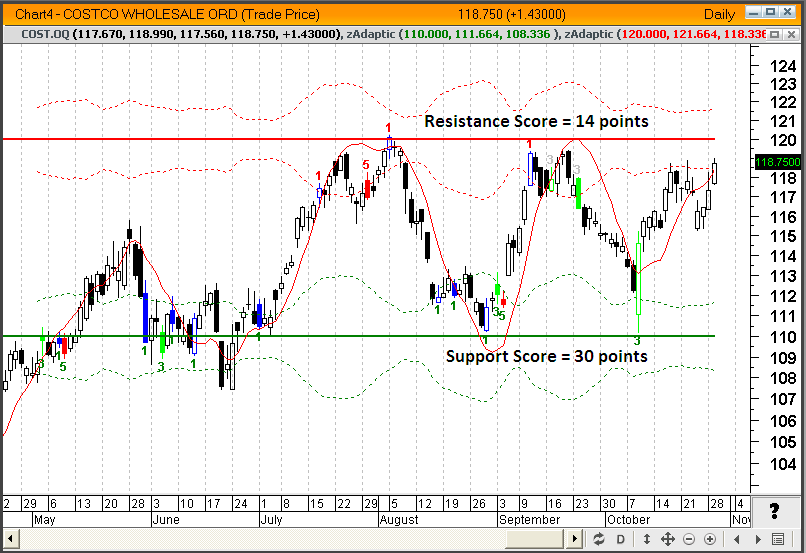
The following chart of Costco illustrates this scoring system. Pivots highs that occurred near the 120 strike price totaled 14. Pivot lows near the 110 strike price totaled 30. “Near” is precisely defined as pivot highs and lows that form within the volatility bands drawn at each level. From this we can objectively state that support at
$110 is stronger than resistance at $120.
My point in presenting this scoring method is not to sell you on this specific method of identifying support and resistance; it is simply to illustrate that it is possible to take the ambiguity and “art” out of technical analysis, even something as subjective and seemingly imprecise as support and resistance. Do this and you may avoid becoming a “starving artist.”
2 comments:
Thanks for sharing this, this is amazing. i like it. PayMyDoctor
Thanks for this type of blog. SecureSpend card
Post a Comment