Friday, June 27, 2014

Swing Trading Runs: TYL – by Martha Stokes CMT

Velocity Runs and Momentum Runs
The market has been moving with plenty of momentum and velocity activity this past week despite the rather weak performances of the major indexes. June is rarely a month that offers so many great swing trading opportunities, but this June is proving to be a solid month for swing trading.
Swing Traders need to be able to quickly distinguish between a “momentum” run and a “velocity” run, as this alters how long you can hold the stock, how far it is likely to move, how it will behave when it meets resistance, and where to place trailing profit stops.
In recent years, many swing traders have learned a very bad habit that may be tough to get rid of: the exit-too-soon bad habit. The market had been in a platform market condition for so long and most swing traders were unaware of this fact.
They attempted to trade platforms with swing style trading strategies and quickly were whipsawed out of their trades, or took losses after a day or two when the stock was actually moving up and they had been in profit. This leads to many swing traders taking profits within the trading day to avoid losing what limited profits they had made.
If a swing trader continues to do so now, with a true momentum market underway, they will miss out on the significant profit potential that momentum runs offer. That is why it is now critical to learn to distinguish between a momentum run and a velocity run. When a trader can see the distinct differences, the proper trailing profit stop can be determined to allow the stock to run as far as it will go before exiting the trade.
Instead of settling for 10- or 25-cent profits, technical traders can earn several points over a few days’ time with lower risk.
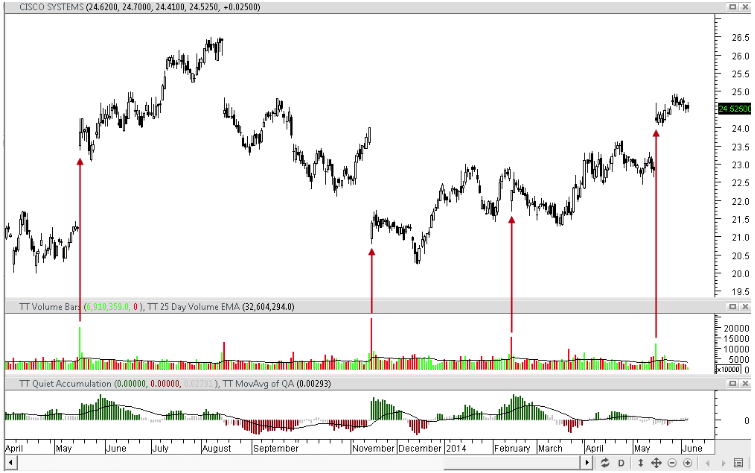
Below is a chart with a velocity run. A velocity run has several key elements:
  1. Volume continues to rise during the run up.
  2. Volume declines before price reverses most of the time.
  3. Price rarely overlaps day to day, and often has small common gaps between days.
  4. A “Shift of Sentiment” pattern in TechniTrader’s Quiet Accumulation (TTQA), which is an accumulation/distribution indicator.
  5. The TechniTrader Volume Accumulation (TTVA) indicator, which is a volume oscillator, shows steady upside accumulation.


Tyler Technologies (TYL) has one of the many new types of bottoms. This is called a basing bottom and tends to form as Dark Pools buy the stock incrementally over extended periods of time. This basing bottom also is compressing upward, an early indication of a base bottom about to complete. The velocity run is marked by the green arrows on both price and volume. The accumulation/ distribution indicator has started a shift of sentiment and the volume oscillator is rising prior to the stock moving upward. Entries with this kind of pattern are made as the bottom starts to move up.
In this example, the stock had a 4-day run so far. The trailing profit stop must be a velocity run trailing profit stop to protect more profits due to the higher energy and higher risk of sudden profit-taking.
Velocity runs are unique to momentum and velocity market conditions. These are found in many charts right now and are excellent swing trading opportunities.
To learn more, click here.

Trade Wisely,
Martha Stokes CMT

Chartered Market Technician
Master Rated Technical Analyst: Decisions Unlimited, Inc.
Instructor & Developer of TechniTrader Stock Market Courses
MetaStock® Partner
© 2014 Decisions Unlimited, Inc. DBA TechniTrader®. All rights reserved.
Disclaimer: All statements are the opinions of TechniTrader, its instructors and/or employees, and are not to be construed as anything more than an opinion. TechniTrader is not a broker or an investment advisor; it is strictly an educational service. There is risk in trading financial assets and derivatives. Due diligence is required for any investment. It should not be assumed that the methods or techniques presented cannot result in losses. Examples presented are for educational purposes only.

Tuesday, June 24, 2014

Employee Spotlight: Hunter S

Name: Hunter S
Time with Company: 3.5 months
Area of company works in: Sales
Do you trade in your spare time: Just paper trading right now
Favorite part of your job: I really enjoy learning new stuff everyday. Theres plenty to learn, so I enjoy the details.
Favorite Quote: "I had a dream that I lived the last day of my life. It was just like any other day just shorter"
Favorite Color: Red
If you weren't working with MetaStock what would you want to be doing: In sales somewhere, Or owning another shop

Friday, June 20, 2014

Anatomy of a Swing Trade: Intel - by Martha Stokes CMT

Many traders open their charting software to see a big gap like the one that happened in Intel (INTC) and then are very frustrated that they were not in the stock before it gapped. Sometimes technical traders will chase such gaps, which is not a good idea most of the time.


This was a swing trade and there were many opportunities to enter the stock prior to the gap.
The goal of a swing trade is to enter prior to or as the run gets underway.


Buyers totally controlled the price action in this run. Note the large white candles that moved price up after each resting phase. They were similar in size and had no viable wicks or tails. Between each rising up day, there were short-term profit-taking days that created resting days, which are continuation patterns, meaning the buying dominance was still intact. All the while, volume patterns were solid and TT Quiet Accumulation indicator patterns confirmed prior accumulation. This is the anatomy of a classic momentum swing trade.


While retail traders were taking profits after a big up day, professionals, who know how to trade momentum runs, simply bought more which caused the resting day patterns. Retail traders took meager profits while pros netted the huge gains of a multiple-day run and then the gap.


Retail traders often cut profits short and let losses grow. This is the opposite of what professionals do and is why professionals enjoy an 80-90% profit rate while retail traders settle for 50-40% or even lower at times.


Retail traders are often scared to death to hold a stock that is moving with momentum. The reason they are not comfortable holding is they have gotten burned too many times with whipsaw trades and now can’t enjoy great profits on a solid momentum run swing trade. This happens when the wrong indicators, wrong entry signals, and outdated technical analysis are employed in stock selections.


Trading should not be a strategy. It must be a process that uses analysis that eliminates every stock but the strongest stocks to trade for swing style momentum.


Price indicators do not reveal who is controlling price. Dark Pools buy in incrementally and do not disturb price. Without Accumulation/Distribution indicators and Volume bars to study alongside candle patterns, it is impossible to determine a momentum move that is about to commence and how to manage the trade thereafter. All technical swing traders need to be able to anticipate the momentum prior to the stock gapping or running so fast there is no time to enter.


For INTC, there were several entries as noted on the stock chart above. Holding through the minor profit-taking is an easy decision to make when the proper indicators are studied and the correct candle patterns identified. Then, the gap provided even more profits. The probability of a gap by High Frequency Traders was evident in the chart before the stock gapped.  
 
Summary:  We’re seeing better swing style momentum right now than there has been all year, and this buying energy sets up well for HFTs to push prices up for great gains for those who are able to recognize the strength-building patterns. Set yourself up for success by learning to use the best tools for identifying momentum in stocks: the modern-day Candlestick patterns, Volume bars and Accumulation/Distribution indicators.


For more on indicator patterns that set up for swing style momentum, click here.


Trade wisely,


Martha Stokes CMT
Chartered Market Technician
Member of Market Technicians Association
Master Rated Technical Analyst for Decisions Unlimited, Inc.
Instructor and Developer of TechniTrader® Stock Market Courses
MetaStock® Partner


© 2014 Decisions Unlimited, Inc. All Rights Reserved.
TechniTrader is the Registered Trademark of Decisions Unlimited, Inc.


Disclaimer: All statements, whether expressed verbally or in writing are the opinions of TechniTrader its instructors and or employees, and are not to be construed as anything more than an opinion. Student/subscribers are responsible for making their own choices and decisions regarding all purchases or sales of stocks or issues. At no time is any stock or issue on any list written or sent to a student/subscriber by TechniTrader and its employees to be construed as a recommendation to buy or sell any stock or issue. TechniTrader is not a broker or an investment advisor; it is strictly an educational service.

Friday, June 13, 2014

Understanding Price action in Short-Term Bottoms: ALXN by Martha Stokes CMT


A short-term bottom is defined as a bottom that tends to complete over a 3- to 5-month period. Sometimes these short-term corrections form more quickly in as little as one month.

Many times, swing and position traders miss out on the wonderful opportunities that short-term bottoms create. Short-term bottoms are often full of momentum energy and can move quickly out of the base. New bottom formations are developing in our electronic marketplace due to Dark Pool trading venues, HFT action chasing Dark Pools, and the new array of orders that are available for each different market participant group.

Learning to identify the patterns of price, quantity, and consistency of volume is the first step to finding excellent momentum trades out of short-term bottoms. Recognizing the new bottoming patterns early on, before the bottom completes, helps position traders see precisely where the bottom is going to most likely complete, which is the ideal entry level for low-risk position trade entries.

A Position Trade is a trade that is held anywhere from 2 weeks to several months. This style of trading is becoming more and more popular as the next generation of traders and investors start learning about the stock market. Since these younger traders are still working, with careers and young families taking a lot of their time, their time constraints require a much simpler, lower-risk entry that generates excellent profits over several weeks to several months.  You can position trade using stocks or you can trade position using options. Both work remarkably well for the busy person who only as a couple of hours a week to trade.

Alexion Pharmaceuticals (NASDAQ: ALXN) is a fine example of just how quickly a short-term bottom can complete.

The Top is one of the newer Top Formations not taught in the older technical analysis books. It rises out of a gap on lower volume. The stock has a flat consolidation before breaking to the downside. If you look at the Volume Bars, you can see why. The volume indicates the gap was created by High Frequency Trading front-running on news for this stock, so this is a gap that is at risk of filling. The top rounds quickly and then HFTs cause another huge black candle on spiking volume again. Since many of the smaller funds chase HFT action by accident, using the wrong type of order which triggers AFTER an HFT volume event, this top was fairly easy to anticipate. The result was the gap filled and then some, moving deep into the prior sideways action before finding support. Quiet accumulation halted the downtrend quickly, and the stock has steadily moved up since then with more strength to the buy side with white candles and volume. TT Quiet Accumulation (TTQA) is shifting sentiment from selling to accumulation.


Looking at TT Volume Accumulation (TTVA), the volume oscillator that compares large lots versus smaller lots and exposes the consistent quiet accumulation volume patterns, we can see that it steadily rose from the HFT volume spike that started the correction. It is obvious by studying the volume and large-lot indicators that Dark Pools were entering during the correction and halted the correction to resume the uptrend. This kind of indicator information is vital to understanding whether a stock is going to continue moving down, stop and start a bottom, or suddenly move with strong momentum.

Learning to read these indicators is easy and fun. Quickly finding stocks is all about using modern leading indicators that give you time to prepare and plan your entries for optimal profits, the lowest risk, and the most enjoyable trading experience.

Most traders are chasing stocks, frustrated, stressed-out, and trying to nibble a couple of pennies from trading. This makes trading hard, extremely stressful and emotional. And it increases risk and lowers profits.

Learn to trade with leading indicators that take the guesswork and stress out of trading.

Short-term bottoms confirmed with leading volume-based indicators are stock chart patterns that can help you prepare early for strong entries and they’re everywhere right now with stock prices recovering from the recent correction.

Learn more about TTQA, TTVA, and other leading hybrid indicators in this video.
 
Trade wisely,
Martha Stokes CMT


Chartered Market Technician
Member of Market Technicians Association
Master Rated Technical Analyst for Decisions Unlimited, Inc.
Instructor and Developer of TechniTrader® Stock Market Courses

©Copyright 2014 Decisions Unlimited, Inc. All Rights Reserved.
TechniTrader is the Registered Trademark of Decisions Unlimited, Inc.

Disclaimer: All statements, whether expressed verbally or in writing are the opinions of TechniTrader its instructors and or employees, and are not to be construed as anything more than an opinion. Student/subscribers are responsible for making their own choices and decisions regarding all purchases or sales of stocks or issues. At no time is any stock or issue on any list written or sent to a student/subscriber by TechniTrader and its employees to be construed as a recommendation to buy or sell any stock or issue. TechniTrader is not a broker or an investment advisor; it is strictly an educational service.

Thursday, June 5, 2014

$CSCO: How to Interpret Island Gaps By Martha Stokes CMT

Island Gaps are uniquely different from common, breakaway, or running gaps. Most common gaps fill quickly. Breakaway gaps rarely fill, and running gaps are often huge.

The Island Gaps do fill, but the time it takes to fill the gap can be several weeks to months.

CSCO has had many island gaps form recently. Most of the gaps were caused by High Frequency Trading or HFT pre-market orders that filled the queues before the market opened, forcing market makers to set a higher or lower price for the stock at open.

Below is the original chart with arrows to show when HFTs caused the gaps. In the second chart, the islands are circled so that you can see them more easily. Not every island gap was caused by HFTs. Some were simply overnight order flow that drove price up or down before the market opened. Some are due to overseas markets’ prices that were lower or higher than the US market and so the stock price was adjusted before the market opened to the price that the stock was trading at overseas. This is done regularly to make sure all prices of stocks are the same around the world. Otherwise, if CSCO was trading lower in, say, Europe and opened higher in the US, that would create an arbitrage situation that could be exploited by many traders selling the stock in two different markets.


Island gaps reflect retail reactions to news events.  Often when the retail side of the market is unaware of a problem with the company, when the news is released, HFT orders trigger huge numbers of sell orders which cause the stock to gap down due to adjustments made by market makers in response to the imbalance of sell and buy orders. Whenever there is a huge imbalance between buy and sell orders, the risk of a gap rises.

This is why it is not a good idea to use news to buy or sell stocks, and why you should not be using a recommendation service or analyst advisories. By the time you get the news, the HFTs have already moved price, often substantially, and all you are doing is chasing that stock which results too often in a loss for the retail trader.

Gaps are common nowadays due to the market structure and how news is used by HFTs. You can take advantage of HFTs IF you learn how to analyze price action before the stock gaps so you are entering before the HFTs instead of after.


If you study the chart, you will see that once a gap down or gap up occurred, the price action did not move much, and it often reversed from the gap price for a few days.

To have a profitable trade, the entry must be made prior to the gap. If you wish to learn to trade gaps, first you need to understand why, when, and how they form. Some stocks, like CSCO, gap frequently and patterns reveal the risk of a gap. Entering after a gap usually poses a higher risk of a whipsaw as profit-taking often occurs over the next couple of days.

Watch a Video on Candlestick Analysis.

Trade wisely,

Martha Stokes CMT
www.MarthaStokes.com

Chartered Market Technician
Member of Market Technicians Association
Master Rated Technical Analyst for Decisions Unlimited, Inc.
Instructor and Developer of TechniTrader® Stock Market Courses
Metastock® Partner

©copyright 2014 Decisions Unlimited, Inc. All Rights Reserved.
TechniTrader is the Registered Trademark of Decisions Unlimited, Inc.

Disclaimer: All statements, whether expressed verbally or in writing are the opinions of TechniTrader its instructors and or employees, and are not to be construed as anything more than an opinion. Student/subscribers are responsible for making their own choices and decisions regarding all purchases or sales of stocks or issues. At no time is any stock or issue on any list written or sent to a student/subscriber by TechniTrader and its employees to be construed as a recommendation to buy or sell any stock or issue. TechniTrader is not a broker or an investment advisor; it is strictly an educational service.