Friday, July 28, 2017

An Amazing Technique for EUR/USD from Domistock's Technical Rating System

Domistock Tools Used: Fast Dominant Hedging Signal System, Auto-drawn Support/ Resistance Lines & Trendlines, Trading Strategies - Tools Exploration, DomiStock’s Technical Rating System
When EUR/USD gets an A rating on a daily chart it attracts the portfolio optimizers and the trading algorithms of the leading investment funds. When it gets an A rating on an intraday chart it attracts trading algorithms of more speculative funds.
When it gets an A rating on both a daily and an intraday chart this means that both the leading investment funds and speculators are looking for opportunities to long EUR/USD.
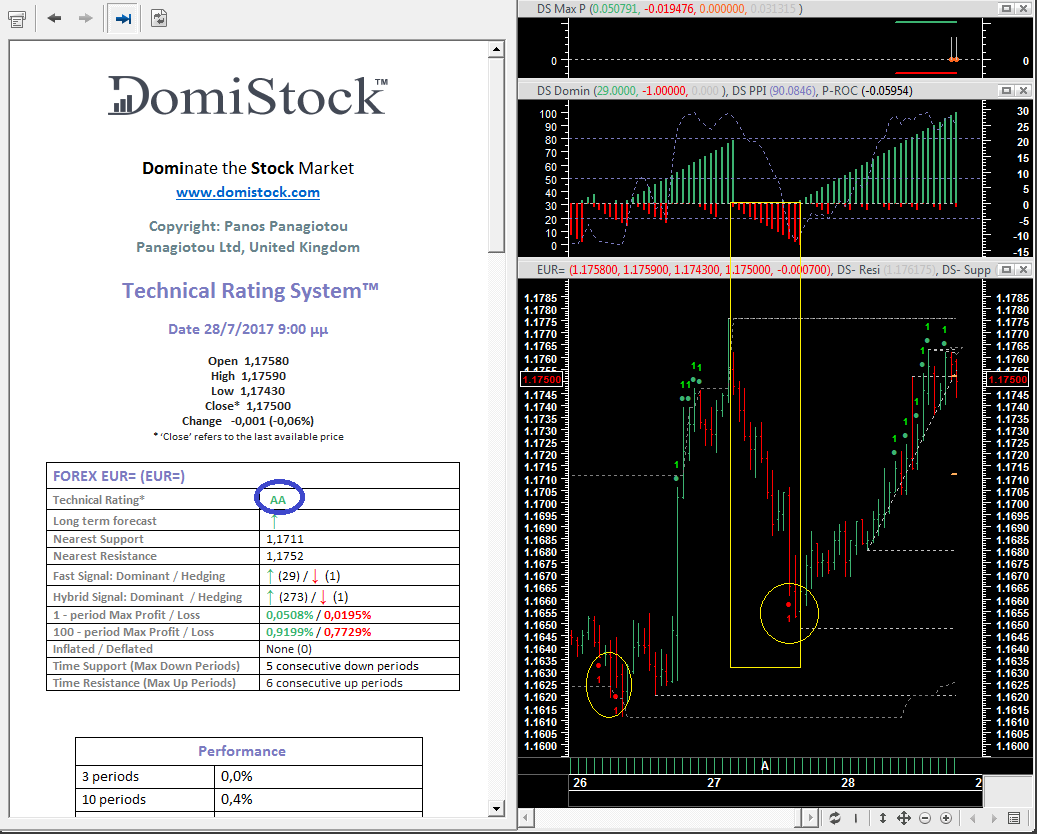
And one of the best opportunities is when it gets deflated. Then it becomes a candidate for DomiStock’s “Long the deflated winner” strategy. This strategy brought some amazing profit in the last 3 sessions on the 60 min chart of EUR/USD, where the rating was an A and it got a price deflation alert three times, marking two major intraday bottoms.
The “Long the deflated winner” gets a “go long” confirmation when there are either dominant or hedging “buy” orders. And that was the case for both of EUR/USD’s rallies while during it’s correction move the “sell” orders where the dominant ones, as sawn from the Dominant & Hedging Signal System.
It’s important to remember that DomiStock’s tools are made for the modern market ecosystem where over 90% of trading is done automatically.

Thursday, July 20, 2017

Confirmed intraday trade with DomiStock’s “Long the deflated winner” strategy

Domistock Tools Used: Dual Dominant Hedging Signal System, Fast Dominant Hedging Signal System, Trading Strategies - Tools Exploration, Inflated/Deflated Alert, DomiStock’s Technical Rating System
In my previous post, I demonstrated one money making trading technique I use with both daily and intraday charts. It is one of DomiStock’s automated strategies (there is an exploration that scans for plenty different techniques and informs the trader which one is the best at any given time) and it's called the ““Long the deflated winner” strategy.
It involves an A rated security (A= winner security) that becomes deflated (It may or may not have a dominant or hedging up signal – this means that DomiStock spots incoming buying orders, either dominant or hedging ones – ). SPY was a candidate for this strategy today and that was the message on my previous post “Live: Intraday profit from DomiStock’s “Long the deflated winner” strategy’.
And it worked like a charm. On the circle is the price deflation alert DomiStock produced while SPY was still falling. That alert came as SPY had a confirmed A intraday rating (AB). From that point and on SPY moved higher. So why does this work? Who bought at that specific hour DomiStock marked SPY as deflated?
It all comes down to how the modern market ecosystem where 90% and more of the trading is algorithmic. If you check the daily technical rating of SPY you will see that its a solid AA. That is a quantitative rating similar to those the leading global funds use. When a trading algorithm of an investment fund’s portfolio optimizer sees that a security has an A rating but that has also become deflated when measured with historical data, it turns on its buying mode and adds to its current position. A position that since that moment was hedged with selling or short orders. And all that happens automatically. DomiStock’s innovative tools monitor that in real time and inform the trader with on chart and of chart tools.
And then it moves on tp automatically plot the new support and resistance levels, the trend lines and much more.

Like this article?  Follow the Domistock blog for multiple stories just like this daily.  

Thursday, July 13, 2017

CUE 360 Degrees Analysis of Apparel & Accessories Stocks

From the desk of Sagar Nandi and Superior Profit:

The possibility of these Long and Short trades was shared in Superior Profit Traders Community a few days ago.

At that time we had a profitable trade in Finish Line (FINL), a Stock that we had analyzed in Weekly Market Roundups as Fundamentally Strong and at Optimal Price. We had used 360 Degrees Analysis for Finish Line at that time.

Here we provide the follow up in detail to the possible Long and Short Trade-Ideas. By joining the Traders Community, you could have a heads up on the trades probably!

​We begin our 360 Degrees Analysis with CUE Edge Industry Analyst. It calculates the performance of 160 Industry Groups across multiple review periods and assigns Ranks and Heat Map Colors that instantly helps us see which Industries are getting stronger and which ones are getting weaker. Reading the data is easy. Magenta color means weakness. Cyan represents strength.

From the easy to read Visual Heat Map, we can instantly see the following:

1) Apparel Industry was languishing at the bottom for many months, with some of the worst ranks (160 being the worst possible rank among the 160 Industry Groups). Today, on 12th July 2017, it improved rank from 131 to 108.

2) Clothing and Accessories Industry was weak 12 months ago. During the month 1 to month 5, it tried to improve a bit. In the most recent periods, this Industry has again declined in Rank, indicated by the magenta color in the times from 10 days to 1 day.

What about their Fundamentals? We have a look at CUE Vital Scorecard for that. For CUE Vital Fundamental scoring, green and blue means strength and magenta, red represents weakness. Higher scores mean the Stocks is stronger than others in the Peer Group.

From Visual Scorecard, we can instantly see that LB (L Brands) is priced optimally and has strong fundamentals at the current price. And COH (Coach) is overpriced and poorer (than LB) earnings quality.

What about their Technical Analysis view? We use CUE Global for that.

LB dropped along with the Apparel Industry since Dec 2016 as seen from the CUE Hop On Daily chart. At the right edge, it stopped going down after exhausting down move that began in July 2017.

Technically, LB may give a possible Bounce Long Trade Setup. You may check the Unambiguous Checklists of CUE Trading System to pinpoint the Entry of either a Swing Long Trade or even a Long Term Investment. We have already seen from CUE Vital analysis that LB is fundamentally strong - this is our preference for Long Term Investing.

You may also keep an eye on Apparel Retailers Industry Rank from CUE Edge in coming days to add more probability of success to your Long Position's favor. That is, Buying LB if the Stock goes up and the Industry also shows strength. 

Contrary to L Brands, Coach (COH) had a nice rally since Dec 2016. But now it is looking a bit tired. That, along with its weak fundamentals and the Industry's (Clothing and Accessories) weakness means one may consider booking profit or at least protect profit using Stop Order. CUE Vital Fundamental showed it is Overpriced!

Short Traders may even look for potential Short opportunity using CUE Global's Unambiguous checklist to pinpoint Short entry.

Using 360 Degrees Analysis in this manner, combining Industry, Fundamental and Technical Analysis, you can invest and trade confidently. Knowing that you have looked at the trade holistically before taking it.

And that is the Superior Profit Way.

Trade Profitably!

Sagar
______________________________________________________________________________

These products are not a recommendation to buy or sell, but rather a guideline to interpreting the specified analysis methods. Only investors who are aware of the risks inherent in securities trading should use this information. MetaStock in no way endorses the products and services advertised and accept no liability whatsoever for any loss arising from any use of these products or their contents.
Thursday, July 6, 2017

Invest with Confidence, Being your own Personal Stock Analyst

From the desk of Superior Profit and Sagar Nandi.

Have you wondered how and why stock analysts regularly promote stocks that are at 52 Week High and say "These are wonderful buying opportunities"? Or why they wanted you to buy the stock at the very top and not while it was going up from a lower price?

Take Tesla (TSLA) as an example, seen using CUE Hop On chart template. In the chart, green/cyan are Bullish, red/magenta are Bearish. Yellow is Neutral. 

If you were listening to the media and Stock Analysts, you were probably hearing a lot about Tesla going up and up and away.

However, Tesla dropped after displaying several magenta (Flow) color Candle in this Daily chart. Using information from the CUE chart and the Fundamentals of the Stock using CUE Vital Fundamentals, you could Protect Profit in Long Position and possibly get ready to Short the Stock for Swing Trading.

Tesla is just one case. Instead of relying on other's recommendations that seem to confuse more than help, you could come up with your Buy/Sell Recommendation of a Stock yourself quickly and objectively using CUE 360 degree analysis. You could do that with Tesla, or with any other company in the world.

Here is another example of how CUE Traders gave a Buy Recommendation on a Stock in the USA Market using CUE 360 degrees analysis.

The Buy conclusion on the Stock CECE (USA) was achieved by combining Industry Analysis (using CUE Edge Sector-Industry Analyst), Fundamental Analysis (using CUE Vital Fundamental Analyst) and Technical Analysis (using CUE Global Technical Charts). This holistic CUE Analysis gives you a 360 degrees view of what is going on in a Stock. And you can Buy (or Short) more confidently.

CUE Edge Industry Analyst

CUE Edge Industry Analyst ranks Industry Groups in Real Time to show which ones are getting stronger and which ones are being weaker.  This Ranking updates in Real-Time. You always have the most up to date information at your fingertips.

You do not even need to read the actual Ranks. Reading the Heat Map colors is enough. If you see an Industry is changing color from magenta in earlier months to cyan in recent months, you know it is getting stronger.

If you see multiple related Industries are getting stronger at the same time, then you have more confidence in the strength, which was the case with Industrials when we analyzed them in the Live Weekly Market Roundup of Saturday, 1st July 2017 (this is shown in the CUE Edge Industry Ranking Table above). Recording of the session is available on Video Center under Weekly Market Roundup.

How might you use this insight? If Industrials were gaining strength, you could look for Buy Position in Industrials, of course!

CUE Vital Fundamental Analyst

As a Stock Analyst, your next task as to find an Industrial Stock that had the right (low) price. CUE Vital Fundamental Analyst helps you do this analysis visually in minutes.

CUE Vital analyzes a Stock in itself and also relative to its Peer Group of Stocks. Presents all the data into multiple categories using easy to read color codes. There are various pieces of Fundamental information. For quick decision, you might just look at the CUE Vital Scorecard.

When we analyzed CECE using CUE Vital, the Scorecard looked like this on 3rd July 2017.

I will point to the few pieces of information here. You may get more detail on it from the Education Center.

1) CUE Vital can fetch a Stock's (CECE, in this case) Industry Peers and compared the Fundamentals. CUE Vital applies a Score of 1 to the weakest Stock and bigger scores to stronger Stocks across multiple dimensions. And finally, CUE Vital creates a Heat Map using intuitive color coding. Green/Blue is "healthy" or "preferred" condition. Red/Magenta is "weak" or "not preferred" status. Yellow is Neutral. That simple.

2) From column B you could instantly see that CECE had one of the best Earnings Reliability Score. Just seeing the Blue color was enough.

3) From column C you could immediately find out that Relative to its Peers, CECE was valued optimally.  Blue background color told you that.

4) From column D's Blue color, you could infer that CECE had high Internal or Intrinsic Value.

5) Additionally, from column I, you could observe that CECE had a high possibility of Short Squeeze, again, merely reading the Blue color did the work for you.

What you had then? A Stock (CECE) with High Earnings Reliability that was Optimally Priced in itself as well as in comparison to its Peers and the Stock had a chance to shoot up due to Short Squeeze.

We already saw, using CUE Edge Sector-Industry Analyst that the Stock was in an Industry that was gaining strength.

You needed one last check before you could decide to Buy this Stock.

CUE Global Technical Analyst

You only make money Buying a Stock if the Stock goes up.

If you buy it while the Stock is going down, that is called "catching a falling knife". And you end up losing money. You probably would rather Buy a Stock that is not falling, like all other CUE Traders.

Therefore, the third and the last leg of CUE Analysis before deciding to Buy a Stock is to see if the Stock has stopped falling. Starting to go up. Or at least, forming a Base at the bottom and showing signs of strength.

You can analyze all these (and more) using CUE Global Technical Analysis. CUE Global Charing is also a Visual Tool like CUE Edge and CUE Vital.

On 3rd July, CUE Global chart of CECE looked like this (seen using Backdrop Weekly chart on the left and Hop On Daily chart on the right).

The chart labels tell the story. You may learn more about the colors and indicators on the chart from the Education Center.

Now, with the 360 degrees analysis, you had a Stock with a Buy Recommendation.  Recommended by yourself!

And your recommendation would work well.

This trade idea was posted in Superior Profit Traders Community on 3rd July (here is the link to the post). And within two trading days, on 6th July, it has hit the Profit Target.

You may use the CUE 360 degrees analysis in this ways on any Market and any Stock in the world.

A) You might look for Industries that are weakening to either Protect Profit in Long Position or even to Short a Stock using CUE Edge Industry Analyst.

B) You might look for Fundamentally Weakest Stocks for Shorting and the Strongest Stocks for going Long using CUE Vital Fundamental Analyst.

C) You could pinpoint the exact Entry and Exit points of your investments and trades using CUE Global Technical Analyst.

With these three tools, you have everything to be your Stock Analyst. And invest confidently for profit.

Sagar