HOW CAN I SEARCH FOR SECURITIES BASED ON FUNDAMENTAL DATA?
MetaStock can only screen securities based on price data and price based indicators. However,
MetaStock Professional, through the XENITH program can search for and screen stocks
based on a much more diverse set of criteria. To do this:
1. Open XENITH.
2. Look at top left and find the blue icon that shows a magnifying glass over a page (Advanced
Search).
3. Click the icon and then select Equites -> Companies
4. The Companies Search screen will open.
5. In the bottom left, click the Add Criteria button.
6. Select the desired fundamental data from the list
7. A new line will be added to the search screen and you can enter the requirements for that data
value.
8. Add as many other criteria as desired and then click Search.

Showing posts with label Monitor Newsletter. Show all posts
Showing posts with label Monitor Newsletter. Show all posts
Friday, November 1, 2013


Slauson's Slant: MetaStock Monitor SEPTEMBER - OCTOBER 13
The Starving Artist - Contributed by John Slauson
One of the biggest challenges in developing a trading systems is being precise when defining the rules. Technical analysis is often criticized because many of its adherents are so ambiguous with their methodology. So ambiguous in fact that it becomes impossible to validate their “system” using any semblance of scientific methods. This is convenient for the trading system peddler, but frustrating for the trader. Among technicians, the well worn adage “the trend is your friend” is sadly second only to “technical analysis is an art not a science.” The latter is a euphemism for: “I have a system that works super awesome...except when it doesn’t.”
Some examples of ambiguous trading rules I often hear:
Prices should move slightly above….
Volatility can increase a bit….
Place the stop just above a recent high…
Prices should cross above the moving average on big volume...
Prices will reverse at about the same price level several times…
The trend must be steeply up over the short-term…
The black candlestick must be significantly larger than the preceding white candlestick…
To move technical analysis out of the realm of art and into the realm of science, ambiguous words like the ones in bolded italics must be eliminated and replaced with precise, quantifiable values.
Of all the tools used by technicians, support and resistance is perhaps the most difficult to quantify. Ask 10 traders to draw support and resistance lines on the same chart and you’ll see lines drawn at almost every price level Years ago I developed a scoring method to help traders quantify support and resistance levels. I presented this method at a conference sponsored by Golden Gate University. In attendance was W.H.C. Bassetti, editor and coauthor of the classic book, Technical Analysis of Stock Trends first written by Robert D. Edwards and John Magee in 1948. Bassetti referenced my scoring method and the MetaStock Add-on based on it (PowerStrike), in the 9th edition of his book.
The methodology I presented for measuring support and resistance is based on three phenomenon in the stock market:
1. Humans prefer “easily” divisible and memorable numbers (e.g.,
“20” is preferred over “19”). These values are typical of option
strike prices. Hence many traders' attention is drawn to these
numbers providing the potential for even more "concentrated"
buying and selling.
2. Stock prices are heavily influenced by trading near option strike
price levels. Hence, these levels greatly influence where
"important" buying and selling occur. Support and resistance is
based on the concentrated buying and selling. Option Strike
Price levels attract more attention from important market
participants over other price levels.
3. Bullish and Bearish pressures at Option Strike Price levels
resolve more quickly than pressures at other levels.
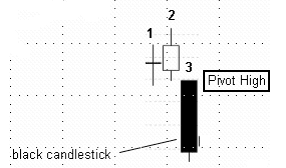
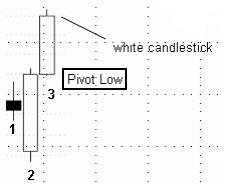
With these general principles in mind, I developed a tool that scored the strength of support and resistance on optionable US stocks. The heart of the scoring method revolves around three bar pivot highs and three bar pivot lows. A value of 1, 3 o 5 points is assigned to a pivot high or low based on the volume associated with bars 1 and 3 of the pattern.
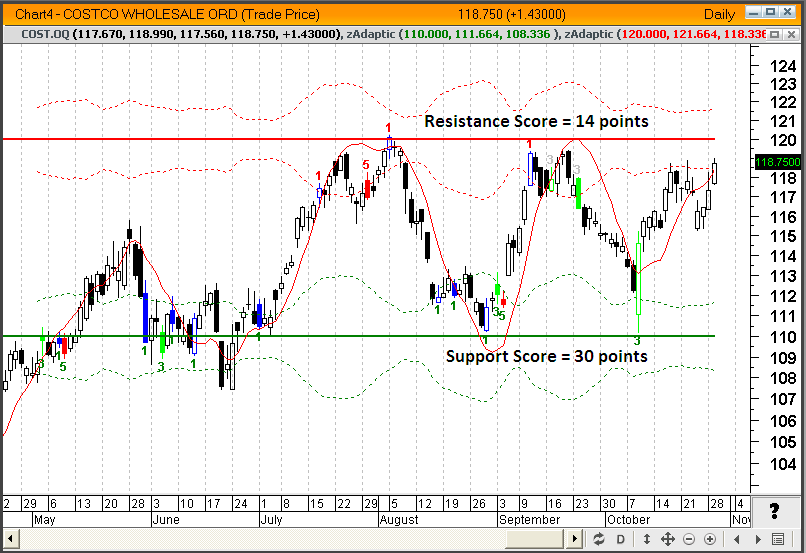
To be counted in the score a pivot highs or lows has to form within a specified distance (based on precise volatility bands) from an option strike price. Totaling these values provides a specific score for the support or resistance level being measured. The score can then easily be used independently or incorporated into a larger set of trading rules. It can even be backtested, an important litmus test for a valid trading method.
The following chart of Costco illustrates this scoring system. Pivots highs that occurred near the 120 strike price totaled 14. Pivot lows near the 110 strike price totaled 30. “Near” is precisely defined as pivot highs and lows that form within the volatility bands drawn at each level. From this we can objectively state that support at
$110 is stronger than resistance at $120.
My point in presenting this scoring method is not to sell you on this specific method of identifying support and resistance; it is simply to illustrate that it is possible to take the ambiguity and “art” out of technical analysis, even something as subjective and seemingly imprecise as support and resistance. Do this and you may avoid becoming a “starving artist.”
Power User Tip: MetaStock Monitor SEPTEMBER - OCTOBER 13
MetaStock Power User Tip
Using Excel with XENITH
Contributed by Breakaway Training Solutions
In this short video, I'll give you a couple of quick tips on how to get your real-time data from XENITH into an Excel spreadsheet.
For more MetaStock training, make sure to visit Breakaway Training Solutions at www.learnmetastock.com or email Breakaway Training Solutions at admin@breakawayts.com.
About Kevin Nelson
Kevin Nelson is the founder of Breakaway Training Solutions, Inc. He has spent the last 17 years becoming an expert on MetaStock software and a serious student of technical analysis while working for MetaStock. Prior to joining MetaStock in 1993, Kevin was a stockbroker for a well-known NYSE firm. In his role as Sales Manager at MetaStock, Kevin interacted extensively with MetaStock customers via phone, webinars, and public appearances. His experiences while working at MetaStock have enabled him to gain a keen understanding of the needs of technical analysts worldwide. While with MetaStock, Mr. Nelson was a featured presenter for four years. During this time, he traveled the U.S. introducing the MetaStock program to thousands of people and teaching them how to use its many features. His easy-to-understand approach is considered by many to be the best in the industry.
Thursday, July 18, 2013
Main Article: MetaStock Monitor JULY - AUGUST 13
Main Article
Using the "Dr. Stoxx Trend Trading Toolkit" to Trade Mean Reversions
Contributed by Dr. Thomas K. Carr
The Mean Reversion setup has impeccable credentials. Versions of it are used by some of the best known and most successful technical traders and analysts. It has been tested and back tested every way imaginable, proving itself profitable in all market conditions on all security types and derivatives. When the Mean Reversion system is done properly, there is no more exciting, more profitable, and yet more (nearly) mechanical trading system out there.
The key thesis of the Mean Reversion system is stocks that trade a statistically significant distance in price away from their mean, measured in our case by a moving average, tend, once a point of equilibrium is reached, to revert to that mean in short order. What we are adding to this thesis is that when we limit stocks that have travelled far from their mean to only those showing strong growth potential (for longs) or the lack thereof (for shorts), we improve our odds significantly of a successful reversion. This reversion is what we trade.
INTRODUCING THE SYSTEM
The Mean Reversion concept came into its maturity with market technician and financial analyst, John Bollinger (b. 1950). Bollinger swapped out Keltner Channels' use of ATR (Average True Range) for standard deviation (2.0). With this revision, Bollinger created trading bands that both envelop most of the price action over time, but are also dynamic enough to show changes in both volatility and directionality.
The Mean Reversion system I teach uses Bollinger Bands as its primary technical tool. On the longs side of the system, we are looking for stocks that have traded outside of the lower Bollinger Band, and which are trading significantly under their "mean" (the 20sma). I also apply a fundamental filter which favors those stocks that show strong earnings growth, low debt to equity, and recent institutional and/or insider buying.
On the shorts side of the system, we are looking for stocks that have traded outside of the upper Bollinger Band, and which are trading significantly above their "mean". Our fundamental filter on this side of the system looks earnings deceleration, and institutional and/or insider selling.
The Mean Reversion system detailed below is one I recommend you always trade in market-neutral pairs. This means for every long position you take you will need to find a short to mate it with; and for every dollar you have in that long, you should put a dollar into the matching short. The long/short pairs are treated as a single position: they are entered at the same time and exited at the same time. When done well, this system can hand you double digit monthly returns, and triple digit annual returns, regularly and reliably. The spreadsheet shown below (Figure 1) is my trading log for an eight week test (2012) of the system using a real-money account of $10,000. The average gain per week, including the losing weeks, was +3.3%. This is about in line with subsequent tests of the system. The total ROI was over 28%, or roughly +170% annualized with the compounding of gains.

TRADING THE MEAN REVERSION SYSTEM
Before you begin trading the Mean Reversion (MR) system, please remember that no claim is being made that following the step by step procedure as stated below will lead to profitable trading. It has in my case, but it may not in yours; nor in mine going forward. With that disclaimer out of the way, let's get down to work. Here are the tools needed to trade this system:
- Use MetaStock's "Dr. Stoxx Trend Trading Toolkit" if you do not want to program in your own scan. You will find both the long and short version of this system preprogrammed into the "Long + Short Mean Reversion Scan" in the TTTK add-on. With a single click of the mouse, you can scan the markets in real time for current MR setups.
- You will also need to bookmark the following website. We will be using this free service to perform a basic but very thorough fundamental analysis on whatever stocks pass our technical scan:
- Navellier's "Portfolio Grader" (Google the name and you'll get the URL)
RUNNING THE LONGS VERSION
STEP 1: Open MetaStock and go to the Power Console. Click on the "Explorer". Select "STTK - Long + Short Mean Reversion Scan." From the "Select List(s) to Explore" table, highlight "U.S. Optionable Stocks" or any other list you wish to scan. Click "Next", then click "Start Exploration". Make a watch list of charts for all passing candidates.
You should get 6 to 10 passing candidates each day. Since this scan targets price extremes, you will normally have more long candidates than shorts in downtrending markets, more short candidates than longs in uptrending markets, and fewer candidates of both sorts in less volatile markets. When the general market is itself outside the upper or lower Bollinger Band, you may get dozens of passing candidates come through the scan. In this case, it is best to modify the moving average filter. When you open the "Edit" function for the "STTK - Long + Short Mean Reversion Scan", you will see the following code line:
- C< Mov(C,20,S) * 0.9
Simply change the "0.9" multiplier to 0.87 and run the scan again. Keep lowering the multiplier if needed until you attain a list of only 10 to 15 passing candidates.
STEP 2: Take your list of passing candidates and input them, one by one, into Navellier's "Portfolio Grader". When you do so, you will see 11 categories each with a grade ranging from "A" (best) to "F" (worst). There are three general categories: "Fundamental", "Quantitative" and "Total". We are only interested in the "Fundamental" grade.
Your best candidates for the long side of the MR system will show an "A" or "B" for its "Fundamental" grade. If you have a number of "A" and "B" candidates, give favor to those with the highest grades in the first four "growth" categories: "Sales Growth", "Operating Margin Growth", "Earnings Growth", and "Earnings Momentum". Two or more "A's" is a good indicator that we have a strong candidate for this system.
STEP 3: Do further discretionary analysis on any passing candidates from Steps 1 and 2. At the least, this should involve checking the headlines for any possible "deal breaker" story about each company. Stocks usually hit extreme prices for good reason, but these setbacks often provide trading opportunities as they bounce back to the mean. What we want to avoid in this important step is getting into any company that is experiencing systemic problems. These can include things like accounting scandals (remember WorldCom?), an unexpected FDA rejection, mines and wells that run dry, and so on. We want to avoid these things.
This system works best when traded in market-neutral fashion with long-short pairs. Thus once you have completed Step 3, you will want to run Steps 1, 2 and 3 for the shorts side of the system (simply reverse the "Portfolio Grader" requirement to favor stocks showing "D" or "F") and trade accordingly.
STEP 4 (position management): There are a number of ways to manage the paired positions in the MR system. The one that generates a higher win percentage is as follows:
- Exit any MR system long/short pair using a "Market on Close" order after 3 full trading days have passed since entry, if and only if either the long or the short position is trading at or beyond the 20sma (above the 20sma for the long, below for the short), or
- 10 trading days have passed since entry, whichever comes first
CHART EXAMPLES
Hawaiian Airlines, Inc., (HA) began as a regional airline back in 1929 with two small planes serving residents of the islands. Today it serves 8 million passengers a year who fly all over the Pacific Rim. Though hard hit in 2013, HA has been known as a strong growth stock with its acquisition of new planes, hubs, and destinations. It is also a prime study in Mean Reversion: it has signaled ten MR longs since January, 2009, eight of which were profitable. In the chart below (Figure 2), you will two of those signals straddling either side of a downtrend. Note that the MR system returned +20% going long over a period when the stock itself traded down:

Biolase, Inc., (BIOL) is a medical equipment maker that among other things makes dental lasers, pain treatment applications, and 3D imaging machines. The shares of the company, long the target of the momentum day trading crowd, have a way of getting ahead of themselves. Its chart looks like a silhouette of the Grand Tetons. Once these peaks reach equilibrium, where supply and demand match up evenly, it is time to put on the short position. The MR system is designed to catch these reversals of momentum. In the chart below (Figure 3), you will see three such shorting opportunities totaling over +38% ROI.

About the Author:
Aka "Dr. Stoxx", Dr. Thomas Carr is the founder and CEO of Befriend the Trend Trading, and author of two bestsellers: Trend Trading for a Living and Micro Trend Trading. He has been actively trading the markets since 1996 following several years of studying technical analysis. He is also the Founder and CEO of Kingdom Capital, LLC, and a General Partner of The 8:18 Fund, LP. He is the developer of the strategy used by the 8:18 Fund and is sole manager of the Fund's portfolios.
Dr. Carr earned Masters and Doctorate degrees in Philosophy from Oxford University (UK). He is a tenured Professor and has over 16 years of investment, trading and trader training experience. In 2002, he founded Befriend the Trend Trading, LLC, an investment advisory service offering three daily market letters and various trading seminars. He is also the author of two bestselling books, Trend Trading for a Living (McGraw-Hill, 2007) which has been translated into Korean and Chinese, and Micro-Trend Trading for Daily Income (McGraw-Hill, 2010). Dr. Carr has been interviewed by the Wall Street Journal and the US News and World Report for his expertise in market psychology. He also had a series of articles published in Stocks and Commodities Magazine.
Support Tip: MetaStock Monitor JULY - AUGUST 13
Support Tip
Where are the exploration options?
Contributed by MetaStock Support
In prior versions of MetaStock, the Explorer had two sets of options. One set was for all explorations and accessed from the Options button when viewing the list of available explorations. The other set was specific to each exploration and accessed from the Options button in the Exploration Editor. Both of these options screens have been combined in the current MetaStock. To access the Exploration Options:
1) Open the Power Console. (When you open MetaStock, the Power Console automatically opens for you.)

OR

2) Select the Explorer on the left side.

3) Select an exploration and click "next." For this example, we chose the "Equis - MSU-Rank" exploration.

4) Select any list(s) to explore and click "next."

5) You will now see the exploration options.

6) If you want to refine your exploration, do so here. Once you are satisfied with the set parameters, click "start exploration."
Slauson's Slant: MetaStock Monitor JULY - AUGUST 13
Slauson's Slant on Trading
Forecasting with Grandpa's Trick Knee
Contributed by John Slauson
Since the late 19th century, weather forecasters have measured barometric pressure to predict the weather. The earliest barometers were invented in the 17th century. They were made of a basin of water and a glass tube. As the atmospheric pressure changed, the level of water in the tube fluctuated up and down. Since then, more accurate methods of measuring barometric pressure have emerged. Even so, my grandpa swore that changes in the pain level of his trick knee were more accurate than any of the fancy instruments used by meteorologists.
As technology has advanced, so has the reliability of weather forecasts. Forecasters have developed a wide assortment of new tools. They feed data into complex computer models that provide increasingly accurate forecasts. The key to their accuracy is using a wide variety of tools to analyze the data such as barometers, radar, satellites, and weather balloons. If their computer models were limited to data from a single tool like a weather balloon, then almost certainly their forecasts would be pretty dismal.
Forecasting the weather and forecasting the markets have many similarities. I learned an important principle from John Bollinger many years ago that I later used in the ICE add-on for MetaStock. Mr. Bollinger emphasizes the importance of avoiding technical indicators that have collinear variables. What does this mean? Here's how he explains it: "A cardinal rule for the successful use of technical analysis requires avoiding multi-collinearity amid indicators. Multi-collinearity is simply the multiple counting of the same information. The use of four different indicators all derived from the same series of closing prices to confirm each other is a perfect example."
In practical terms for MetaStock users wanting to build reliable trading systems, it means they should use indicators that measure a variety of market behaviors rather than many that measure the same behavior. For example, the two most popular technical indicators are RSI and Stochastics. With only slight variations, these two indicators are almost identical. The chart below shows a 14-day Stochastic and a 14-day RSI along with the correlation of the two in the top inner window. Note: the correlation coefficient is extremely high, ranging between 0.80 and 0.90. They are almost perfectly correlated. Even without using correlation, it is visually obvious that the two rise and fall in unison.
While two indicators being highly correlated (like RSI and Stochastics) does not necessarily mean they cannot be a valuable part of a trading system, in this case with the mathematical formulation underlying each indicator being so similar, you can be sure that there is little to be gained using both in the same system. So just like weather reporters, you should use a variety of different tools, not variations of the same tool.

One of the reasons we get sucked in to using collinear indicators is they optimize very well. The optimized results of a set of collinear indicators almost always show better historical performance than does a set of non-collinear indicators. Why? Because it is much easier to "curve fit" a system comprised of three highly correlated momentum indicators than a system comprised of different categories of indicators. A system that is curve fit to the past will rarely perform well in the future. Unfortunately you can't make money trading the past.
A better approach is to combine indicators that measure different dynamics such as momentum, trend, volume, and volatility. When building a trading system consider using indicators from at least three of these four categories. The table below shows some of the MetaStock indicators categorized into these four categories:

For example, RSI, Chaikin Money Flow, and Bollinger Bands when carefully combined into a system will provide non-collinear input that will likely perform better in the future. RSI measures momentum, Chaikin Money Flow measures strength using volume, and Bollinger Bands measure volatility.
And if you can figure out a way to work grandpa's trick knee into your system, then perhaps you will have found the holy grail!
About John Slauson
John Slauson began his career with MetaStock in 1988. In 2000, he left and started Adaptick, a company that provided training and developed popular MetaStock add-ons ICE, FIRE and PowerStrike. Over the years, he's worked closely with industry experts like John Bollinger, Steve Nison, John Murphy, and Greg Morris. In 2008 he returned to MetaStock as a Product Manager.
Power User Tip: MetaStock Monitor JULY - AUGUST 13
MetaStock Power User Tip
Bollinger Bands - Part 3
Contributed by Breakaway Training Solutions
In this third and final video on using Bollinger Bands in MetaStock, Kevin Nelson will show you how to color-code your price bars when you get a Bollinger Band squeeze and how to get buy and sell signals when the prices break outside of the bands.
For more MetaStock training, make sure to visit Breakaway Training Solutions at www.learnmetastock.com or email Breakaway Training Solutions at admin@breakawayts.com.
About Kevin Nelson
Kevin Nelson is the founder of Breakaway Training Solutions, Inc. He has spent the last 17 years becoming an expert on MetaStock software and a serious student of technical analysis while working for MetaStock. Prior to joining MetaStock in 1993, Kevin was a stockbroker for a well-known NYSE firm. In his role as Sales Manager at MetaStock, Kevin interacted extensively with MetaStock customers via phone, webinars, and public appearances. His experiences while working at MetaStock have enabled him to gain a keen understanding of the needs of technical analysts worldwide. While with MetaStock, Mr. Nelson was a featured presenter for four years. During this time, he traveled the U.S. introducing the MetaStock program to thousands of people and teaching them how to use its many features. His easy-to-understand approach is considered by many to be the best in the industry.
Thursday, May 23, 2013
Main Article: MetaStock Monitor MAY - JUNE 13
Social Trading the Dow
Contributed by eToro


eToro’s vision is to become a global market place for all people to invest and manage their funds in a simple and transparent way.
eToro is committed to maintain the world’s largest and most trusted investment network, designed to financially empower individual investors through a simple, innovative trading platform and an active social trading community.
Contributed by eToro
"The Dow Jones Reaches a New Record High" - This headline is hardly news anymore, due to US stocks reaching new all-time highs approximately twice a week, since the beginning of 2013. Nowadays the media is more likely to consider a week without record highs for the Dow as breaking news.
With that said, many analysts and traders remain skeptical about the reasons behind these dramatic moves. The US economy is certainly not performing better than ever before, and although data releases indicate recover (albeit a slow one), there are still plenty of reasons for investors to be concerned.
At the same time, Wall Street investors are singing an old and merry song, which goes something like this:
Money is cheap and credit is loose, time to invest, give the economy a boost.
What can we buy or what can we sell, when bond yields are low and real estate is stale.
Corporations will grow long term and short, so equity shares are the best to report.
What can we buy or what can we sell, when bond yields are low and real estate is stale.
Corporations will grow long term and short, so equity shares are the best to report.
We can see the strong sentiment very clearly by glancing at this chart.
You don’t need any lines to see the clear upward trend, but when will it end? And what can you do to prepare for it?
Social trading offers an interesting solution for dealing with bubbles such as this. As long as the bubble keeps inflating, it makes sense to take advantage of the upward momentum, however, if you know the downfall is imminent you also have to hedge your positions in the opposite direction.
This is where social trading comes in.
Social trading links traders from all over the world into one big network. It empowers traders to use each other’s skills and collective wisdom to trade smarter together.
Across a broad social investment network there will be traders on both sides of the fence and some who are sitting on the fence.
For example;
Robysms61 from Switzerland has a moderate following of almost 10,000 traders. Currently 3,705 of them are copying his trades with their real money accounts. He strongly believes this entire rise is a big bubble and is holding short positions on the Dow Jones and S&P 500. His Dow Jones target is currently at 13,000 just around that big gap from New Year’s weekend. (Here are Robysms61's results.)
On the other there is Schultieboy, a new trader from Holland. In just 2 short months this trader has managed to quadruple his initial investment and is currently holding some very green long trades on several different stock indices. (Here are Schultieboy's results.)
A wise investor knows diversification is key so, by copying both these traders, we should be able to profit from both points of view and trading timeframes.
Another cool advantage of investing socially is being able to gauge the overall sentiment, or the "Wisdom of the Crowd."
Since the beginning of the year, the social sentiment on the eToro network has been growing increasingly negative when it comes to the stock market. Point in fact: at the moment, 96% of our top traders are selling the S&P 500.
The following chart demonstrates the overall bearish exposure on the S&P of all the traders in the eToro network on a weekly basis since January 2013.
The black line is the monthly moving average, where we can see the bearish trend starting to emerge.
In the words of John Maynard Keynes, a very famous economist,"the markets can stay irrational longer than you can remain solvent."
As long as the markets remain irrational, the only rational thing to do is to spread your investment to cover all possible scenarios. This is the number one reason to diversify as much as possible.
You can achieve maximum diversification by copying diverse investors who are in turn diversifying their own portfolios. This way, whatever happens in the world your exposure will be spread out and much safer.
To learn more about social trading, visit www.etoro.com.
About the Author:
eToro is the first global market place for people to trade currencies, commodities and indices online in a simple, transparent and more enjoyable way.
eToro is committed to maintain the world’s largest and most trusted investment network, designed to financially empower individual investors through a simple, innovative trading platform and an active social trading community.
Today, eToro empowers over 2.75 million users in more than 140 countries worldwide to manage their funds through their innovative online investment platforms and active trading community, with thousands of new accounts created every day.
For more information on eToro, please visit their website.
Support Tip: MetaStock Monitor MAY - JUNE 13
Support Tip
How do I control how an indicator is scaled?Contributed by MetaStock Support
Adding indicators to charts in MetaStock is as simple as dragging and dropping. But what about scaling for the indicator? When you add an indicator to an inner window or copy or move an indicator to another inner window, it is likely that the other inner window's y-axis scale will not be compatible. If this is the case, MetaStock displays the Scaling Options dialog so that you can choose how to handle the scaling when the plot is overlaid.
For this example, we will use a chart of Apple and a Stochastic Oscillator for the indicator.
Let's take a look at the available options:
For any indicator scaling you want to execute, you must do the following steps regardless of which scale you choose.
- After opening a chart in MetaStock, drag and drop the indicator anywhere on the chart. You will know the indicator is going to be applied in the chart when the price bars turn pink.
- After setting the parameters of your indicator, select "OK." You will be asked what you want your scaling options to be. Here are the scaling options and how to apply them.


1) Display New Scale on Left
- For this example, we select "Display new scale on left."
- After selecting "New scale on left" and clicking "OK" the indicator will appear over the prices on the chart. Notice the new scale on the left side of your chart. This scale is directly related to the plotted indicator. Since the Stochastic Oscillator is based on a scale of 0 - 100, you will notice this is the scaling used on the left with blue overbought and oversold lines at 20 and 80.


2) Display New Scale on Right
- For this example, we select "Display new scale on right."
- After selecting "New scale on right" and clicking "OK" the indicator will appear over the prices on the chart. Notice the new scale on the right side of your chart. This Stochastic Oscillator scale has replaced the pricing scale. Since the Stochastic Oscillator is based on a scale of 0 - 100, you will notice this is the scaling used on the right with blue overbought and oversold lines at 20 and 80.


3) Merge with Scale on Right
- For this example, we select "Merge with scale on right."
*** If you have a scale on the left side that appears with every chart you open, you can follow the same steps to merge with that scale. If you do not, the "Merge with scale on left" will remain grayed out. - After selecting "Merge with scale on right" and clicking "OK" the indicator is “merged” with the current right scale. Notice the scale on the right side of your chart now displays from -50 to 750 so that it can display both the pricing for Apple as well as the range for the Stochastic Oscillator. So you’re now able to see Apple and the Stochastic Oscillator in the same chart.


4) Overlay without Scale
- For this example, we select "Overlay without Scale."
- After selecting "Overlay without Scale" and clicking "OK" the indicator scale will use the price scale on the chart to plot the Stochastic Oscillator (in this example.) Notice the pricing scale on the right side of your chart is unchanged with the addition of the Stochastic Oscillator. The Stochastic Oscillator is still based on a scale of 0 - 100 with blue overbought and oversold lines at 20 and 80. However, for this example it is using pricing values rather than the 0 - 100 scale. This is useful if you are only concerned with comparing relative movments between the plots.


Please note: You can change the scaling of any indicator already in your chart by right clicking on the indicator and selecting "Scaling." This will display the Scaling Options dialog and allow you to select the desired method.
Slauson's Slant: MetaStock Monitor MAY - JUNE 13
A Stop for All Seasons
Contributed by John Slauson


Contributed by John Slauson
A lot of traders focus on perfecting the perfect entry signal. The thinking is "If I can time my entry well, then a profit is a natural by-product." However, anyone who has traded knows this could not be further from the truth.
I believe many systems could be improved with effective stop losses. It would not surprise me if a monkey throwing darts at a stock chart could generate entry signals that turned consistent profits IF an effective stop loss were used for exits.
A little-known indicator in MetaStock is the IntelliStop. I developed this indicator about 10 years ago to be used as a universal exit signal. It is essentially a trailing stop with a unique twist; it automatically tightens and loosens based on directional volatility.
Volatility (as measured by standard deviation) is non-directional - meaning a sharp upward move has the same impact on the volatility value as a sharp downward move. Intellistops separate upside volatility from downside volatility. Why?
Upside volatility is considered a positive condition for long positions; whereas downside volatility is a negative condition. High upside volatility will cause Sell IntelliStops to tighten in anticipation of a return to normal volatility thereby locking in gains. A sharp downside pullback counteracts the temporary increase in volatility generated by a sharp upside move.
IntelliStops were created with the following principles in mind: let losses die quickly (play defense first), let profits live long, and strive for average profits that outpace average losses by a factor of two. Are IntelliStops the perfect application of this principle? No. But they can be effective.
The following chart shows the Adaptick IntelliStop indicator (Level 2 setting) overlaid on the QQQ. Note that an IntelliStop only resets when it is hit, as illustrated below. This is standard trailing stop behavior. The circled bar penetrated the active stop value, causing it to reset/recalculate on the current bar's low.
To plot the Adaptick IntelliStop indicator on a chart, simply drag and drop the indicator named "zAdaptick - IntelliStop Buy (1,2,3,4, or 5)" or "zAdaptick - IntelliStop Short (1,2,3,4, or 5)" from the Indicator Quicklist and drop it on top of the price plot.
An intellistop should be used the same way you would use any other stop. Using the chart above as a reference, here is an example: Let's say I purchased the QQQ at $68.50 using the monkey's dart and the current price is $73.03. I want to lock in my unrealized gains of $4.53 with an IntelliStop. The current value of the IntelliStop is $71.34. I could place a Good-til-Canceled (GTC) Sell Stop Loss order as shown below (This is Fidelity's order ticket; yours should be similar).
After placing a Stop Loss, you will need to monitor the IntelliStop closely in MetaStock in order to adjust it as necessary. Of course, the stop will never go down in the case of long positions, or up in short positions.
So take a look at IntelliStops. They may improve the performance of your trading systems.
But remember, trading isn't monkey business.
About John Slauson
John Slauson began his career with MetaStock in 1988. In 2000, he left and started Adaptick, a company that provided training and developed popular MetaStock add-ons ICE, FIRE and PowerStrike. Over the years, he's worked closely with industry experts like John Bollinger, Steve Nison, John Murphy, and Greg Morris. In 2008 he returned to MetaStock as a Product Manager.
Power User Tip: MetaStock Monitor MAY - JUNE 13
MetaStock Power User Tip
Bollinger Bands - Part 2Contributed by Breakaway Training Solutions
In this second video of a three part video series on using Bollinger Bands, Kevin Nelson shows you how to create your own custom indicator to help determine when your Bollinger Bands are narrowing. This could be used to help find stocks going through periods of congestion.
For more MetaStock training, make sure to visit Breakaway Training Solutions at www.learnmetastock.com or email Breakaway Training Solutions at admin@breakawayts.com.
About Kevin Nelson
Kevin Nelson is the founder of Breakaway Training Solutions, Inc. He has spent the last 17 years becoming an expert on MetaStock software and a serious student of technical analysis while working for MetaStock. Prior to joining MetaStock in 1993, Kevin was a stockbroker for a well-known NYSE firm. In his role as Sales Manager at MetaStock, Kevin interacted extensively with MetaStock customers via phone, webinars, and public appearances. His experiences while working at MetaStock have enabled him to gain a keen understanding of the needs of technical analysts worldwide. While with MetaStock, Mr. Nelson was a featured presenter for four years. During this time, he traveled the U.S. introducing the MetaStock program to thousands of people and teaching them how to use its many features. His easy-to-understand approach is considered by many to be the best in the industry.
Friday, March 22, 2013
Main Article: MetaStock Monitor MARCH - APRIL 13
A Simple, Powerful Method for Trading Different Market Environments
Contributed by the Dynamic Market Lab, LLC
In 2004, the Dynamic Market Lab, LLC (our, us, we) introduced John Ehlers’ signal processing applications for the markets to the MetaStock community through introduction of the Adaptive Cycle Toolkit (ACT). The intent was clear; demystify powerful, but complex concepts and mathematics for immediate application to trading in the easily understandable MetaStock formula format. As time passed, it became apparent the real insight behind his pioneering work lay not in bringing these engineering tools to bear for market analysis, but in recognizing how these tools should be combined for maximum effectiveness.
In this article, we present one of the best approaches revealed by our extensive work with ACT. The approach is simple, powerful, and allows a trader to quickly, confidently identify different market environments, and execute a logical approach to capitalize on them, or stand down. The approach is described in the ensuing paragraphs, and all code is available from MetaStock with purchase of ACT. Discussion of the approach may appear complex, but we want you to understand the concepts, and feel comfortable with them. Fret not, application of the tools is very simple.
Three ACT or ACT modified functions are used to a) identify trend, b) measure trend strength and noise, and c) identify low risk entry points within a trend. A multi-faceted trading approach across different market modes (trending, drifting) is then suggested. The discussion below may appear complex, but the application of the tools is simple.
This approach is based on the Laguerre Transform, a modified version of David Sepiashvilli’s Trend Quality Indicator (TQI) (the ACT TQI), and a fisher transformed version of the Laguerre Stochastic.
Trend Following:
Use crossovers of price against the Laguerre Filter as the earliest warning of a trend change. Compare these crossovers to the ACT TQI. If prices are above the Laguerre Filter and the ACT TQI is > 1, a strong uptrend is likely in place, and do not trade against it. If prices are below the Laguerre Filter and the ACT TQI is < -1, a strong downtrend is likely in place, and do not trade against it. If you are trend follower, you can use these confirmed signals to initiate a trend position. We leave this to the viewer to examine the charts presented. We believe the confirmation points of the two indicators, and the trend direction to trade, are straightforward.
Mean Reversion Trading: (i.e., buy dips in an uptrend, sell peaks in a downtrend)
Mean reversion trading is based on the simple principle that when prices move far away from their average price they tend to move back to their average. This may be true in both trending and drifting markets. However, we should not employ this approach without a sound method. A strongly trending market can move prices farther from their average than expected.
Use the position of prices relative to the Laguerre Filter, and the ACT TQI to determine the market’s state. If prices are above the Laguerre Filter, and the ACT TQI is > 1, enter long trades only when the fisher transformed Laguerre Stochastic is below -2.5 standard deviations (oversold). If the price “hooks” down near the Laguerre Filter, this is even more desirable for entering long trades. If prices are below the Laguerre Filter, and the ACT TQI is < - 1, enter short trades only when the fisher transformed Laguerre Stochastic is above +2.5 standard deviations (overbought). If the price “hooks” up near the Laguerre Filter, this is even more desirable for entering short trades.
This allows us to buy dips in an uptrend, and sell peaks in a downtrend. We are capitalizing on both trend and price extremes, and using both to raise our odds of success. It is not recommended to use the oscillator values alone to take trades in the opposite direction of a strong trend. At this point, our examination of the market’s state indicates a strong trend exists, and we should not trade against it.
Range Bound or Drifting Markets:
If prices are above the Laguerre Filter, and the ACT TQI is -1< ACT TQI <1, enter long trades only when the fisher transformed Laguerre Stochastic is below -2.5 standard deviations. If prices are below the Laguerre Filter, and the ACT TQI is -1< ACT TQI <1, enter short trades only when the fisher transformed Laguerre Stochastic is above +2.5 standard deviations. During very noisy, drifting scenarios, prices tend to “hang on” to the Laguerre Filter, they are not above it (uptrends) or below it (downtrends.) In such cases, this may not be worth trading, unless the trader is selling options or option spreads to collect premium decay. These are lower probability trades because we do not have the benefit of a strong trend. These trades are strictly “range bound” trades. They may be very profitable during extensive periods of market drift. At the first sign of a price crossover of the Laguerre Filter or ACT TQI value moving beyond the +1/-1 limits, and in directions against your trade, exit immediately.
Please refer to the attached slides, and vertical lines indicating examples of these trade setups based on the rules explained above.
Conclusion:
Three carefully designed tools allow a trader to operate a simple, powerful approach across a spectrum of market conditions. Although the concepts behind the indicators we have discussed may be complex, applying them is not.
Trading is often the most successful when it is simple, and based on sound principles of market behavior. We hope that we have provided a more powerful perspective on market behavior© for you, and that you will take a look at the powerful tools and concepts in the Adaptive Cycle Toolkit (ACT).
ACT is available from MetaStock’s site in a convenient downloadable format on a risk free trial.


Disclaimer:
The Adaptive Cycle Toolkit (ACT) is a product of the Dynamic Market Lab, LLC. The techniques described in this article, and the software and related manuals, are based on approaches some consider to be experimental. As a result, this information is offered for educational purposes only. Concepts or techniques presented are not guaranteed or warranted to be profitable.
Users apply the product strictly at their own risk. They must understand that trading in stocks, commodities or other instruments has significant risks, and substantial losses may occur.
The creators of this product or authors of this article are not acting in a capacity as investment or trading advisers. Readers of this article or users of the product must accept full responsibility for their investment or trading decisions, and should seek professional investment counsel before beginning a trading/investment program.
About the ACT Developers:
Michael Burgess
Contributed by the Dynamic Market Lab, LLC
In 2004, the Dynamic Market Lab, LLC (our, us, we) introduced John Ehlers’ signal processing applications for the markets to the MetaStock community through introduction of the Adaptive Cycle Toolkit (ACT). The intent was clear; demystify powerful, but complex concepts and mathematics for immediate application to trading in the easily understandable MetaStock formula format. As time passed, it became apparent the real insight behind his pioneering work lay not in bringing these engineering tools to bear for market analysis, but in recognizing how these tools should be combined for maximum effectiveness.
In this article, we present one of the best approaches revealed by our extensive work with ACT. The approach is simple, powerful, and allows a trader to quickly, confidently identify different market environments, and execute a logical approach to capitalize on them, or stand down. The approach is described in the ensuing paragraphs, and all code is available from MetaStock with purchase of ACT. Discussion of the approach may appear complex, but we want you to understand the concepts, and feel comfortable with them. Fret not, application of the tools is very simple.
Three ACT or ACT modified functions are used to a) identify trend, b) measure trend strength and noise, and c) identify low risk entry points within a trend. A multi-faceted trading approach across different market modes (trending, drifting) is then suggested. The discussion below may appear complex, but the application of the tools is simple.
This approach is based on the Laguerre Transform, a modified version of David Sepiashvilli’s Trend Quality Indicator (TQI) (the ACT TQI), and a fisher transformed version of the Laguerre Stochastic.
- The Laguerre Transform is an average of prices derived from a mathematically “warped” cross-combination of only three current and past data points at each time interval (based on trader’s selected chart interval for trading). The three data points ensure rapid response to change; the “warped” cross-combination ensures smoothness. Prices tend to rapidly cross and “ride” above (below) the average during uptrends (downtrends), and “hang” on the average during drifting markets. This average is plotted as an overlay on prices in the chart window.
- The original TQI measures trend direction, trend strength, and market drift. It is powerful in its own right, but requires explanation to understand, and understand why we modified it.
- David Sepiashvilli introduced the TQI in a Stocks and Commodities (S&C) article, Trend Quality Indicator, as a technique to measure trend strength and noise. Copies of the article may be purchased online from S&C for $2.95.
- Sepiashvilli uses a difference between seven (7) and fifteen (15) period exponential averages to identify changes from an uptrend to a downtrend, and back again. At each crossover point, he resets his computations. He then performs the following steps: 1) measures cumulative bar to bar price change since the crossover point, 2) averages this change to compute the trend, 3) subtracts the trend from the cumulative change to compute the noise, 4) computes the square root of the moving average of the squared noise over time and multiplies this by 2. This multiplication is done so that when trend is compared to noise, if the ratio is 1 (uptrend) or -1 (downtrend), it means the trend is as strong as twice the noise. This “factor of 2 times noise” is a benchmark often used for distinguishing the onset of a trend from noise, 5) finally, he computes the ratio between the trend and noise. If the ratio is > 1, an uptrend is in force. If it is <-1, a downtrend is in force. If the result is – 1 < ratio < 1, the market is considered to be drifting. According to Sepiashvilli, the higher (lower) the ratio, the greater the strength of the uptrend (downtrend).
- We originally plotted the MetaStock version of this indicator from Stocks and Commodities Trader’s Tips code, but observed the code had an error. This was evident from the fact the indicator was not centered around zero. Since the indicator is reset at every crossover point (see above), it must by definition move back and forth across the zero line. Based upon discussion with a contact on the MetaStock forum, we were able to get corrected code that plots correctly for Sepiashvilli’s original formulation. We can supply this corrected code.
- A basic premise behind using adaptive tools is that markets are dynamic. Fixed period lengths do not always timely identify shifts in markets between trends, cycles and noise. Although the logic behind the TQI is very sound, we thought we might be able improve it a bit by replacing the fixed period lengths with ACT functions.
- Enter the ACT indicators named Mama/Fama (Cybernetic). These are nonlinear averages that speed up / slow down based on how fast the measured cycle is changing. Fama is set to follow behind the rate of change of Mama. The relationship between these two adaptive averages means it is hard for the two to cross, or cross by very much, unless a meaningful move has occurred. If Mama and Fama are substituted for the seven (7) and fifteen (15) period values in the TQI, this means it will be very difficult for the two to cross enough to exceed the noise thresholds of 1 or -1, unless a meaningful move has occurred. Furthermore, these two averages are adaptive and should rapidly change as market conditions change. Thus, there is little need to continue to optimize fixed values (such as 7, 15) for moving averages. In trading systems, the fewer the optimized parameters, the more robust the system tends to be.
- In constructing the inputs for Mama/Fama, we drew upon another concept from Ehlers’ work - ACT’s Signal to Noise function. We set a variable equal to this ratio, and used it to accelerate or slow down Mama/Fama’s cycle based computations. In other words, we would let both market cycles, and market noise, tell us what is happening.
- In daily plots of IBM (2000 through early 2007) (not shown to save space, available upon request), Sepiashvilli’s choice of parameters was quite robust, and tracked our ACT TQI quite closely. However, there were six periods during this time, ranging from a few weeks to a month, the ACT TQI identified range bound markets (-1 < ACT TQI < 1) much better than the original TQI. In candor, there was one time the original TQI was superior. The original TQI registered a slight uptick in value a few days before there was a price up gap…luck, maybe, but it did nonetheless. However, it is interesting to note the other six periods where the ACT TQI performed better, the markets made a more continuous transition from one price to another, and did not exhibit an abrupt gap.
- Thus, there is reason over a substantial span of years for a market which fell heavily, rose heavily, and drifted to believe the ACT TQI improved the traditional TQI, and thus we will use this modified version (i.e., the ACT TQI.)
- The ACT TQI is plotted in the first indicator pane. The red horizontal lines are placed at +1 (weak uptrend = 2* noise) and -1 (weak downtrend = 2* noise). If the ACT TQI > 1, an uptrend is in force. If the ACT TQI < -1, a downtrend is in force. If the -1 < ACT TQI < 1, the market is drifting. Divergences between the ACT TQI and price are, like other traditional divergences, a warning sign of possible, imminent change.
- Lastly, the fisher transformed version of the Laguerre Stochastic (FLS) is a statistically transformed version of a stochastic indicator, except the stochastic is computed from three prices first “warped” through application of the Laguerre mathematics. The three data points ensure rapid response to change; the “warped” cross-combination ensures a smooth stochastic. The fisher transform is then applied to the Laguerre Stochastic to ensure it is properly distributed according to the normal distribution function (i.e., bell curve in statistics). Many market price variations do not fit the normal distribution, and the fisher transform is one statistical technique that can be applied to help ensure computations based on such prices are normally distributed. The FLS is plotted in the second indicator pane. The red horizontal lines are placed at +2.5 standard deviations (potentially overbought) and -2.5 (potentially oversold).
Trend Following:
Use crossovers of price against the Laguerre Filter as the earliest warning of a trend change. Compare these crossovers to the ACT TQI. If prices are above the Laguerre Filter and the ACT TQI is > 1, a strong uptrend is likely in place, and do not trade against it. If prices are below the Laguerre Filter and the ACT TQI is < -1, a strong downtrend is likely in place, and do not trade against it. If you are trend follower, you can use these confirmed signals to initiate a trend position. We leave this to the viewer to examine the charts presented. We believe the confirmation points of the two indicators, and the trend direction to trade, are straightforward.
Mean Reversion Trading: (i.e., buy dips in an uptrend, sell peaks in a downtrend)
Mean reversion trading is based on the simple principle that when prices move far away from their average price they tend to move back to their average. This may be true in both trending and drifting markets. However, we should not employ this approach without a sound method. A strongly trending market can move prices farther from their average than expected.
Use the position of prices relative to the Laguerre Filter, and the ACT TQI to determine the market’s state. If prices are above the Laguerre Filter, and the ACT TQI is > 1, enter long trades only when the fisher transformed Laguerre Stochastic is below -2.5 standard deviations (oversold). If the price “hooks” down near the Laguerre Filter, this is even more desirable for entering long trades. If prices are below the Laguerre Filter, and the ACT TQI is < - 1, enter short trades only when the fisher transformed Laguerre Stochastic is above +2.5 standard deviations (overbought). If the price “hooks” up near the Laguerre Filter, this is even more desirable for entering short trades.
This allows us to buy dips in an uptrend, and sell peaks in a downtrend. We are capitalizing on both trend and price extremes, and using both to raise our odds of success. It is not recommended to use the oscillator values alone to take trades in the opposite direction of a strong trend. At this point, our examination of the market’s state indicates a strong trend exists, and we should not trade against it.
Range Bound or Drifting Markets:
If prices are above the Laguerre Filter, and the ACT TQI is -1< ACT TQI <1, enter long trades only when the fisher transformed Laguerre Stochastic is below -2.5 standard deviations. If prices are below the Laguerre Filter, and the ACT TQI is -1< ACT TQI <1, enter short trades only when the fisher transformed Laguerre Stochastic is above +2.5 standard deviations. During very noisy, drifting scenarios, prices tend to “hang on” to the Laguerre Filter, they are not above it (uptrends) or below it (downtrends.) In such cases, this may not be worth trading, unless the trader is selling options or option spreads to collect premium decay. These are lower probability trades because we do not have the benefit of a strong trend. These trades are strictly “range bound” trades. They may be very profitable during extensive periods of market drift. At the first sign of a price crossover of the Laguerre Filter or ACT TQI value moving beyond the +1/-1 limits, and in directions against your trade, exit immediately.
Please refer to the attached slides, and vertical lines indicating examples of these trade setups based on the rules explained above.
Conclusion:
Three carefully designed tools allow a trader to operate a simple, powerful approach across a spectrum of market conditions. Although the concepts behind the indicators we have discussed may be complex, applying them is not.
Trading is often the most successful when it is simple, and based on sound principles of market behavior. We hope that we have provided a more powerful perspective on market behavior© for you, and that you will take a look at the powerful tools and concepts in the Adaptive Cycle Toolkit (ACT).
ACT is available from MetaStock’s site in a convenient downloadable format on a risk free trial.
Disclaimer:
The Adaptive Cycle Toolkit (ACT) is a product of the Dynamic Market Lab, LLC. The techniques described in this article, and the software and related manuals, are based on approaches some consider to be experimental. As a result, this information is offered for educational purposes only. Concepts or techniques presented are not guaranteed or warranted to be profitable.
Users apply the product strictly at their own risk. They must understand that trading in stocks, commodities or other instruments has significant risks, and substantial losses may occur.
The creators of this product or authors of this article are not acting in a capacity as investment or trading advisers. Readers of this article or users of the product must accept full responsibility for their investment or trading decisions, and should seek professional investment counsel before beginning a trading/investment program.
About the ACT Developers:
Michael Burgess
- Co-founder of The Dynamic Market Lab, LLC. Conceptualized the ACT product.
- He received published credit for his editorial contributions to Cybernetic Analysis for Stocks and Futures, and has a unique perspective on John Ehlers work.
- He has over twenty (20) years of experience as a consultant with domestic and international corporations dealing with complex issues such as derivatives and other financial issues.
- He holds a BA from Duke University, and a Masters in Taxation from the University of Denver's Graduate Tax Program.
- Co-founder, and developer for The Dynamic Market Lab, LLC.
- He has been a C++ application developer for a healthcare software company, a mobile application developer, a technology coordinator in the ethanol industry, and currently provides litigation support work in the software and technology fields to several leading companies.
- He holds BS degrees in computer science and mathematics from Vanderbilt University with a background in algorithm design, signal processing, statistics, and numerical analysis. His academic experience includes the design and implementation of algorithms for recent mathematical theory on irregular sampling and reconstruction of digital signals in shift-invariant and wavelet spaces.
Support Tip: MetaStock Monitor MARCH - APRIL 13
How do I create a custom list?
Contributed by MetaStock Support
The Custom List Manager lets you create your own lists. The lists chan contain as many instruments from as many groups as you want. You can use these lists in the Power Console to view charts, run explorations, and run system tests. Here's how you can create your own custom lists:
1) To create a new custom list, click on either the "Tools" menu or click the "Manage Custom Lists" button at the bottom of the power console.

OR

2) After the Custom List Manager opens, click "New."

3) Enter a name for the list.

4) Enter symbols, one at a time, in the "Select Instrument(s)" field, clicking "Add" after each one.

OR look the instruments up (if you don't know the ticker symbol).

Search by the instrument name or symbol and options will auto populate below. Select the appropriate instrument name and click "OK."

5) Click "Save" to return to the Custom List Manager.

6) You can access your newly created Custom List by clicking on "Tools", then "Custom List Manager" or the Power Console.

OR

Contributed by MetaStock Support
The Custom List Manager lets you create your own lists. The lists chan contain as many instruments from as many groups as you want. You can use these lists in the Power Console to view charts, run explorations, and run system tests. Here's how you can create your own custom lists:
1) To create a new custom list, click on either the "Tools" menu or click the "Manage Custom Lists" button at the bottom of the power console.
OR
2) After the Custom List Manager opens, click "New."
3) Enter a name for the list.
4) Enter symbols, one at a time, in the "Select Instrument(s)" field, clicking "Add" after each one.
OR look the instruments up (if you don't know the ticker symbol).
Search by the instrument name or symbol and options will auto populate below. Select the appropriate instrument name and click "OK."
5) Click "Save" to return to the Custom List Manager.
6) You can access your newly created Custom List by clicking on "Tools", then "Custom List Manager" or the Power Console.
OR
Power User Tip: MetaStock Monitor MARCH - APRIL 13
Bollinger Bands - Part 1
Contributed by Breakaway Training Solutions
Bollinger Bands are one of the most popular and well known indicators in the world of technical analysis. Most traders use Bollinger Bands as a way to determine market volatility. In this first video of a three part video series on Bollinger Bands, Kevin will show you how to use Bollinger Bands inside of MetaStock. He’ll cover the basics of how they’re calculated, how to interpret them and discuss some of the different types of patterns to watch for. Have a look!
For more MetaStock training, make sure to visit Breakaway Training Solutions at www.learnmetastock.com or email Breakaway Training Solutions at admin@breakawayts.com.
About Kevin Nelson
Kevin Nelson is the founder of Breakaway Training Solutions, Inc. He has spent the last 17 years becoming an expert on MetaStock software and a serious student of technical analysis while working for MetaStock. Prior to joining MetaStock in 1993, Kevin was a stockbroker for a well-known NYSE firm. In his role as Sales Manager at MetaStock, Kevin interacted extensively with MetaStock customers via phone, webinars, and public appearances. His experiences while working at MetaStock have enabled him to gain a keen understanding of the needs of technical analysts worldwide. While with MetaStock, Mr. Nelson was a featured presenter for four years. During this time, he traveled the U.S. introducing the MetaStock program to thousands of people and teaching them how to use its many features. His easy-to-understand approach is considered by many to be the best in the industry.
©Breakaway Training Solutions, Inc. 2013
Contributed by Breakaway Training Solutions
Bollinger Bands are one of the most popular and well known indicators in the world of technical analysis. Most traders use Bollinger Bands as a way to determine market volatility. In this first video of a three part video series on Bollinger Bands, Kevin will show you how to use Bollinger Bands inside of MetaStock. He’ll cover the basics of how they’re calculated, how to interpret them and discuss some of the different types of patterns to watch for. Have a look!
For more MetaStock training, make sure to visit Breakaway Training Solutions at www.learnmetastock.com or email Breakaway Training Solutions at admin@breakawayts.com.
About Kevin Nelson
Kevin Nelson is the founder of Breakaway Training Solutions, Inc. He has spent the last 17 years becoming an expert on MetaStock software and a serious student of technical analysis while working for MetaStock. Prior to joining MetaStock in 1993, Kevin was a stockbroker for a well-known NYSE firm. In his role as Sales Manager at MetaStock, Kevin interacted extensively with MetaStock customers via phone, webinars, and public appearances. His experiences while working at MetaStock have enabled him to gain a keen understanding of the needs of technical analysts worldwide. While with MetaStock, Mr. Nelson was a featured presenter for four years. During this time, he traveled the U.S. introducing the MetaStock program to thousands of people and teaching them how to use its many features. His easy-to-understand approach is considered by many to be the best in the industry.
©Breakaway Training Solutions, Inc. 2013
Tuesday, January 15, 2013
Main Article: MetaStock Monitor JANUARY - FEBRUARY 13
Point and Figure Charting
Contributed by Remould Robert (Remo), Director and Founder of www.chartsview.co.uk
Point and figure charting is a popular charting method used in technical analysis. Point and figure charts are used because they are distinctive in terms of their analysis and construction, unlike other charts, time does not play a big factor. They are plotted on a grid and are made up of O's and X's. O's are used when the price moves down and X's are used when they go up, each box on the grid will be used for O's or X's.
Prices movements are plotted on the vertical axis (y axis) and direction changes are plotted on the horizontal axis (x-axis), prices are scaled on the vertical axis. A box represents the number of points that you have selected. When the price goes up then you would mark it with an X but only when the market price rises completely through the box then you would place an X in the box, so every full box size will generate an X.
For O's to be generated the price must reverse a minimum of 1-box (1-box reversal) but most commonly used is a 3-box reversal, which requires the correction of 3 boxes before the O's can be plotted. This will help filter out most of the noise so time is not really a factor. Once in the trend the next X or O will only need 1-box move to register on the chart whereas a reversal will require 3-box move in the opposite direction to register. That's why it's called a 3-box reversal. It's up to you what setting you want to use, for example you can use a 5-box reversal but remember this will take a lot longer to see the movements on the chart. Therefore, the usual preference is the 3-box reversal and this is the most common one.
Another way to change the setting will be the price move itself e.g.
The following table will help you to decide what box sizes to use, you should really try and experiment with different box sizes to suit your share.
As can be seen from the chart above when prices reverse the X or the O is not in the same column. Every reversal will start in a new column and it must reverse by 3 to generate a reversal. For example: If you are plotting a 5 by 3 (5*3), 5=box size and the 3=reversal.
If the latest box to be filled is 300 and the price rises to 305 then you would place another X in the 305 box. If then the price rises to 309 then you would ignore this, as it has not moved by 5 points. If the price suddenly moves to 323 then you would place an X up to the 320 mark (310,315,320), you would discard the 323 price as it has not moved by 5 clear points.
If the price then turns down and moves to 313 you would still not plot any O as it has not corrected by 3 box sizes. For a new set of O's to be plotted the price must move 5*3=15 points, the current high is 320 - 15 points therefore 305 will be the level before a new set of O's can be plotted. Remember every box is equal to 5 points so once 305 is hit then you would plot an O in 315, 310 and 305 hence a new column of O's. All the above is based on intraday moves as most point and figure charts are done on intraday.
End of Day
There are different time frames you can use with point and figure. End of day point and figure is plotted exactly like the intraday point and figure but only the closing price is used. So it misses a lot of the intraday moves, a bit like the line charts where all the important levels will be missed. See chart below for end of day:
High/Low
This method uses the whole days moves so you use a lot more data, it totally ignores the closing prices. This method has the advantage that you can read the supports and resistances levels much better and clearer, see chart below for example:
Trend lines


- Trend lines are drawn from an extreme bottom or top with a 45-degree angle attached to it.
- Bullish trend lines are drawn from a known low at 45-degrees pointing upwards.
- Bearish trend lines are drawn from a known high at 45-degrees pointing downwards.

Common Buy and Sell Indicator


Price Targets
Point and figure charts have the ability to project targets; there are 2 ways to count these either using the horizontal or the vertical count.
- Vertical count. Upwards Target - This is done by counting the number of X's in the move up then multiply by the box size and then multiply by the reversal box, i.e. number of X's 6, Box size 1, reversal box size 3 and Target = 18. Once you have your target you use the previous low of O's as the bottom and then you project it from there, you have your target. This is best used from a low point and the reverse is true for downside target.

- Horizontal Target - This is done using congestion area (sideways moves). The way to do the count is for an upside Target Columns x Box size x Reversal. You need to use the move that started the congestion and count from there to the move out of the congestion. So if there are 10 columns (including the start and finish columns) you would multiply that by the box size and then multiply that by the reversal so if box size is 5 and reversal is 3 then you would have 10x5x3 = 150 points target. This then is added to the lowest point of the congestion and projected up from there. The reverse is true for a downside target.

There are many different signals on the point and figure charts and so you do really need to read about them first. The above is just an introduction to point and figure charting.
Advantages
- From the charts you can see almost the entire trading history on one page.
- Easy to see buy and sell signals.
- Trend is clear to see.
- Point and figure charts have targets.
About Remould (Remo) Robert
Remo has over 20 years experience in technical analysis, its his love for technical analysis and his passion to help others to succeed in trading that saw him run one of the most successful private members board in the UK. He decided to take this community further and now runs his own ChartsView community at http://www.chartsview.co.uk, which includes regular technical analysis on shares, great trade set-ups and regular tips, a comprehensive learning section and a community of active traders from around the world.
Subscribe to:
Posts (Atom)