Technical Analysis Advanced Strategies
How to Adapt Chart Analysis for Major Price Deviations
It has been 5 years since the flash crash and the accompanying extreme amplitude that comes with a massive, sudden sell-off due to multiple events. However once again, chartists are struggling to determine how to analyze and incorporate stunning gigantic moves for price in a single day. This is a critical area of Technical Analysis that needs to be addressed and worked through as these major anomalies in single day price variables, is likely to become more common in the future.
For Technical Analysis advanced strategies the first aspect is to understand, which Market Participant Groups actively traded the market on that particular volatile day. It is wrong to assume that a major collapse of stock prices was strictly out of control High Frequency Trader HFTs selling or traders Selling Short.
It is a fact that HFTs tend to trigger in the first few minutes of the day. However intraday charts show all the majority of components for the Dow 30, NASDAQ 100, S&P500 and the Russell 2000 started the trading day with an unprecedented gap down.
This means that the value for these indexes and their stocks was lowered prior to market open. The open gap was not caused by HFTs, but by the automated Market Maker system that regulates the opening price for all stocks traded on the US Exchanges. This automated system takes the End of Day closing prices from overseas markets that trade earlier than the US market, closing just as the US opens for trading. By adjusting prices to match the closing prices of the nearest region which for the US is Europe, the markets avoid arbitrage risk and control as well as manage the numerous variables of a global marketplace.
Technical Analysis advanced strategies begin with realizing once the gaps occurred they were so huge with a surge of volume from HFTs, that Small Funds orders of Volume Weighted Average Price VWAP started selling heavily in the first few minutes of the trading day. Pro Traders who had entered on Friday began Buying to Cover. This is the most important aspect of maintaining an orderly market provided by the Market Participant Groups that Sell Short namely High Frequency Traders, Professional and Proprietary Traders, and Retail Traders. These are the only Market Participant Groups that actively Sell Short and Buy to Cover. When the Buy to Cover orders trigger it slows down the selling, and in fact for the indexes it drove prices back up to the prior day’s closing price within the first hour of the trading day. The remainder of the day was mostly selling by Smaller Funds, and selling by Independent Investors who were afraid of the market activity.
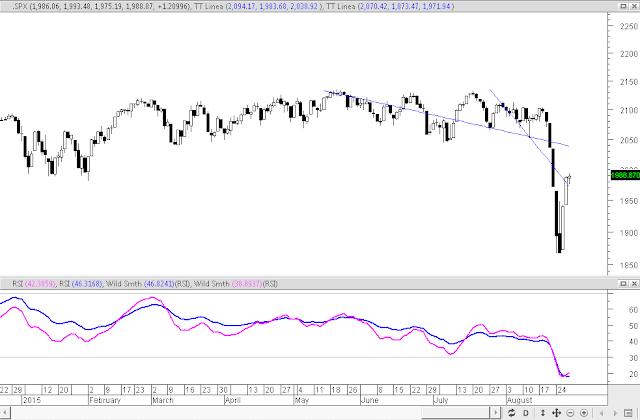
Once a trader understands these wide swings and what causes them, they can determine how to best prepare for the next day. Since this episode was not a US problem but a reaction to the Chinese Stock Market Crash, a bounce and rebound should have been expected.
However this doesn’t mean the Correction of the markets overall is over yet. That correction has been a Trading Range for most of this year but now with most Trading Ranges breaking to the downside, the shift is to an Intermediate Term Correction.
Summary
Most of the time the information traders hear on TV, radio, and the internet is misinformation or hype and inaccurate. Technical Analysis advanced strategies are based on understanding the trigger mechanisms in the market, how regulations and rules affect market open, which Market Participants are using which order types, and then the price action suddenly makes sense.
The charts for the Indexes all show the big move down, and the rebound which happened early in the day. At the end of the day more sellers sold due to fear and panic. How to adapt chart analysis for major price deviations is by using indicators that show which Market Participant Groups sold that day. This is all revealed with the TechniTrader Quiet Accumulation TTQA and the TechniTrader Volume Accumulation TTVA, as well as other indicators.
For Trading and Investing stock market education click the button.
Trade Wisely,
Martha Stokes CMT
TechniTrader technical analysis using a MetaStock chart, courtesy of Innovative Market Analysis, LLC dba MetaStock
This weekly stock discussion is sponsored by TechniTrader.com a MetaStock® Partner
Copyright ©2015 Decisions Unlimited, Inc. dba TechniTrader. All rights reserved.
TechniTrader is also a registered trademark of Decisions Unlimited, Inc.
Disclaimer: All statements are the opinions of TechniTrader, its instructors and/or employees, and are not to be construed as anything more than an opinion. TechniTrader is not a broker or an investment advisor; it is strictly an educational service. There is risk in trading financial assets and derivatives. Due diligence is required for any investment. It should not be assumed that the methods or techniques presented cannot result in losses. Examples presented are for educational purposes only.


