Friday, September 25, 2015

091815 MetaStock Weekly - Support and Resistance During a Downtrend

Support and Resistance During a Downtrend
Market Correction Chart Example
The strength in the levels of support and resistance during a Downtrend or market correction alters as the stock moves down. Often moderate support levels can be broken through with ease and speed, as selling accelerates and momentum drives price down. This is especially true of stocks that are frequently traded by High Frequency Trading firms, Pro Traders, and larger lot Retail Traders.
Normally the low of an upside gap would provide moderate to strong support for a stock in a Downtrend or market correction, especially if the gap was a breakaway gap. See chart example below.


This is a good example of how quickly a stock can fall through a moderately strong support level in support and resistance during a Downtrend. The gap shown with green arrows was a breakaway gap, and is one of the strongest gaps that form in the stock market. It was a High Frequency Trading gap and the stock began to Downtrend without making a higher high from that gap. The support was broken through on a huge run down day, breaking through the gap support area easily. The day after that was another gap down day, which then reversed for a single day.
The velocity at which stock prices can fall is predicated on the Market Participant Groups who sell in panic mode. High Frequency Trading firms often trigger huge runs and gaps down, which in turn trigger Volume Weighted Average Price VWAP sell orders that drive price right through support levels.
For Beginner Traders trying to learn how to navigate through a highly volatile selling pressured market, it is imperative to learn which support levels will hold and which will cave easily to the selling pressure.
For Traders who are learning to Sell Short, it is just as important to be able to determine which technical support level will halt the Downtrend, even if it is only a one day reversal.
Understanding support and resistance during a Downtrend will help all Retail and Technical Traders earn higher profits and avoid trading losses making it more enjoyable, easier, and far less frustrating. Here is a list of what and where is needed in education regarding the Downtrend:
  1. How and why Price moves in a Downtrend
  2. Where Support will cause Professionals who are Technical Traders to Buy-to-Cover their Sell Short positions
  3. Where bargain hunter Dark Pools will start buying
  4. Where “Buy-on-the-Dip” Investors accidentally make the mistake of buying too soon in a Downtrend
Volatility can be a Retail Trader’s best friend. In addition every Trader needs to learn more than just a few Candlestick Patterns, Indicator Crossover Signals, and basic Strategies.
Trade Wisely,
Martha Stokes CMT
www.TechniTrader.com
Instructor & Developer of TechniTrader Stock and Option Courses
This weekly stock discussion is sponsored by TechniTrader.com a MetaStock® Partner

©2015 Decisions Unlimited, Inc. dba TechniTrader. All rights reserved.
TechniTrader is also a registered trademark of Decisions Unlimited, Inc.

Disclaimer: All statements are the opinions of TechniTrader, its instructors and/or employees, and are not to be construed as anything more than an opinion. TechniTrader is not a broker or an investment advisor; it is strictly an educational service. There is risk in trading financial assets and derivatives. Due diligence is required for any investment. It should not be assumed that the methods or techniques presented cannot result in losses. Examples presented are for educational purposes only.

Sunday, September 20, 2015

VR Tutorial for Freeport McMorRan

From the desk of top market timer Mark Leibovit

Companies throughout the commodities industry have gotten hit hard in recent years, with Freeport-McMoRan (NYSE:FCX) suffering a double hit because of its concentrated exposure to the mining and energy industries. Recently, controversy has swirled around Freeport, as activist investor Carl Icahn disclosed a substantial stake last month even as the stock was falling to new multiyear lows. Yet even though Icahn's appearance and the potential for a sale or spinoff of the company's energy assets has helped lift shares from their recent low levels, many investors are forgetting the core challenges that Freeport-McMoRan faces if it wants to recover fully from its extensive losses since mid-2014. In addition, the company said Friday that it has raised $1 billion through a sale of its shares and disclosed plans to sell another $1 billion, as the beleaguered miner looks to raise cash amid weak commodity prices.

Much of the short-term movement has been news driven, that's for sure, but I am monitoring the stock primarily through the eyes of my Leibovit Volume Reversal indicator.  In the daily chart, four Leibovit Positive VRs were formed since August 27 and in the weekly chart, a weekly upside 'Key Reversal' and Leibovit Positive VR were formed - both confirmed by a rising 5/3/3 stochastic. As a result we traded FCX at vrtrader.com on the long side. However, on Friday (directly tied to the aforementioned news announcement), the stock sold off and was accompanied by a Leibovit Negative VR, so we 'rang the register' on the long pay cashing in on nearly a 30% profit.  Though the Leibovit Negative VR and a declining 5/3/3/ stochastic confirm that a short sale is supported here, I am inclined not to take a short trade in a stock that is down from $61.00 a share to $7.76 over the past four years and would rather wait for another buying opportunity.


Wednesday, September 2, 2015

082815 MetaStock - Technical Analysis Advanced Strategies

Technical Analysis Advanced Strategies
How to Adapt Chart Analysis for Major Price Deviations
It has been 5 years since the flash crash and the accompanying extreme amplitude that comes with a massive, sudden sell-off due to multiple events. However once again, chartists are struggling to determine how to analyze and incorporate stunning gigantic moves for price in a single day. This is a critical area of Technical Analysis that needs to be addressed and worked through as these major anomalies in single day price variables, is likely to become more common in the future.
For Technical Analysis advanced strategies the first aspect is to understand, which Market Participant Groups actively traded the market on that particular volatile day. It is wrong to assume that a major collapse of stock prices was strictly out of control High Frequency Trader HFTs selling or traders Selling Short.

It is a fact that HFTs tend to trigger in the first few minutes of the day. However intraday charts show all the majority of components for the Dow 30, NASDAQ 100, S&P500 and the Russell 2000 started the trading day with an unprecedented gap down.


This means that the value for these indexes and their stocks was lowered prior to market open. The open gap was not caused by HFTs, but by the automated Market Maker system that regulates the opening price for all stocks traded on the US Exchanges. This automated system takes the End of Day closing prices from overseas markets that trade earlier than the US market, closing just as the US opens for trading. By adjusting prices to match the closing prices of the nearest region which for the US is Europe, the markets avoid arbitrage risk and control as well as manage the numerous variables of a global marketplace.
Technical Analysis advanced strategies begin with realizing once the gaps occurred they were so huge with a surge of volume from HFTs, that Small Funds orders of Volume Weighted Average Price VWAP started selling heavily in the first few minutes of the trading day. Pro Traders who had entered on Friday began Buying to Cover. This is the most important aspect of maintaining an orderly market provided by the Market Participant Groups that Sell Short namely High Frequency Traders, Professional and Proprietary Traders, and Retail Traders. These are the only Market Participant Groups that actively Sell Short and Buy to Cover. When the Buy to Cover orders trigger it slows down the selling, and in fact for the indexes it drove prices back up to the prior day’s closing price within the first hour of the trading day. The remainder of the day was mostly selling by Smaller Funds, and selling by Independent Investors who were afraid of the market activity.
Once a trader understands these wide swings and what causes them, they can determine how to best prepare for the next day. Since this episode was not a US problem but a reaction to the Chinese Stock Market Crash, a bounce and rebound should have been expected.
However this doesn’t mean the Correction of the markets overall is over yet. That correction has been a Trading Range for most of this year but now with most Trading Ranges breaking to the downside, the shift is to an Intermediate Term Correction.
Summary
Most of the time the information traders hear on TV, radio, and the internet is misinformation or hype and inaccurate. Technical Analysis advanced strategies are based on understanding the trigger mechanisms in the market, how regulations and rules affect market open, which Market Participants are using which order types, and then the price action suddenly makes sense.
The charts for the Indexes all show the big move down, and the rebound which happened early in the day. At the end of the day more sellers sold due to fear and panic. How to adapt chart analysis for major price deviations is by using indicators that show which Market Participant Groups sold that day. This is all revealed with the TechniTrader Quiet Accumulation TTQA and the TechniTrader Volume Accumulation TTVA, as well as other indicators.
For Trading and Investing stock market education click the button.  
http://cdn2.hubspot.net/hubshot/15/08/28/cf875cd3-b042-4452-b554-238b88ba1f07.png
Trade Wisely,
Martha Stokes CMT

TechniTrader technical analysis using a MetaStock chart, courtesy of Innovative Market Analysis, LLC dba MetaStock

Instructor & Developer of TechniTrader Stock and Option Courses
This weekly stock discussion is sponsored by TechniTrader.com a MetaStock® Partner

Copyright ©2015 Decisions Unlimited, Inc. dba TechniTrader. All rights reserved.
TechniTrader is also a registered trademark of Decisions Unlimited, Inc.

Disclaimer: All statements are the opinions of TechniTrader, its instructors and/or employees, and are not to be construed as anything more than an opinion. TechniTrader is not a broker or an investment advisor; it is strictly an educational service. There is risk in trading financial assets and derivatives. Due diligence is required for any investment. It should not be assumed that the methods or techniques presented cannot result in losses. Examples presented are for educational purposes only.


Tuesday, September 1, 2015

LEIBOVIT VR ANALYSIS ON METASTOCK OF ARCH COAL AND PEABODY ENERGY ACI and BTU AUGUST 31, 2015

From the desk of Top Market Timer Mark Leibovit:

Billionaire investor George Soros, who has demonized fossil fuels for years through his think tanks and political contributions, seems to have warmed up to Big Coal now that stocks are dirt cheap. The left-wing hedge fund legend has raised eyebrows with major purchases of stock in two large coal companies, firms his critics say he helped bring to their knees. While buying low is the hallmark of any shrewd investor, buying coal goes against the political and environmental ideology Soros has long espoused. Obama’s Global Warming hoax has hurt domestic coal production. Soros bought a million shares of Peabody Energy (BTU) which was selling for about $90 a share when Obama became President and is now at about one dollar per share.  Soros also reportedly bought a half million shares of Arch Coal (ACI) which is also grossly undervalued. Soros presumably will sell these stocks for a hefty future profit. The rally got underway immediately when Arch Coal announced an extension of its negotiations with bondholders. Then investors discovered that Soros Fund Management recently bought shares in ACI and BTU.   Meanwhile, at VRtrader.com we traded ACI and BTU due to the formation of Leibovit Positive VRs. In the following video I have presented the daily and monthly charts for Arch Coal (ACI) along with Peabody Energy (BTU).  Can you believe ACI traded as high as $774 a share back in June, 2008 and traded as low as $1.00 on August, 2015?

Leibovit Positive Volume Reversals displayed here on Metastock that were formed on July 30 and August 5, along with a rising 5/3/3 stochastic confirmed the beginning of an uptrend.  The monthly chart has flashed a positive 'Key Reversal' pattern.  


---

Come join Mark for a complimentary one hour training session on MetaStock hosted Wednesday September 2nd 2015 from 6-7 PM EST.  Join here.

Happy Trading

Jeffrey Gibby
Business Development Manager
(p) 801 506 1005
(skype) jeffrey.gibby

Monday, August 24, 2015

LEIBOVIT VOLUME REVERSAL (VR) ANALYSIS FOR METASTOCK LOOKING AT THE DJ INDUSTRIALS - AUGUST 24, 2015

From the desk of top market timer Mark Leibovit:

Eight Negative Leibovit Volume Reversals (VRs) (tm) posted beginning on June 24 clearly signaled distribution in the marketplace.  Declining peaks since June 24 also helped confirm the pattern.  Please note that in all but one instance a declining 5/3/3/ stochastic confirmed this pattern. Here in this video we are looking at first the daily chart of the DIA and then peruse the weekly chart which provided further downside confirmation.  The DIA has been trading under both its 50 and 200 day moving averages since August 3 and is now in free fall. In the weekly chart, the 200 week moving average is the next line of defense and it currently stands at 15,400 in the DJ.  Bears are rejoicing and now being vindicated but that is not surprising as warnings for a big correction and/or bear cycle began with a negative 'January Barometer' eight months ago.

View the training video here:

http://youtu.be/QTs2w2Fr-nU

Happy Trading.

Jeff Gibby
MetaStock Business Development


Wednesday, August 12, 2015

Mark Leibovit Video Tutorial For Yum - August 12, 2015


From the Desk of Top Market Timer, Mark Leibovit

LEIBOVIT VR TUTORIAL FOR YUM ON METASTOCK - AUGUST 12, 2015

Seven Leibovit Negative Volume Reversals (VRs) have been formed in YUM BRANDS (YUM) since late June defining a clear and profitable downtrend. Yum Brands, the owner of the KFC and Taco Bell chains, was among the biggest decliners in the S&P 500 on Tuesday.  The fast-food company gets more than half of its sales from China. The company said last month that it was expecting a strong second-half of the year in China. Yum fell $4.28, or 4.9 percent, to $83.54.

A Leibovit Negative VR  accompanied by a declining 5/3/3 stochastic provided traders with a great opportunity to profit ahead of the announcement that China had devalued the Yuan by 2%.


Happy Trading, 

Jeff Gibby

Thursday, July 30, 2015

Setting up a Pre Filter Exploration

A question that I get from some of my new business partners is how can I build a list of stocks that are between $5 and $50 and have a volume of at least a certain number.  The idea is to build a list you can scan against regularly and weed out the securities that you wouldn't be interested in.

Putting together an exploration like this is really easy, and my goal here is to show you how to do it.  

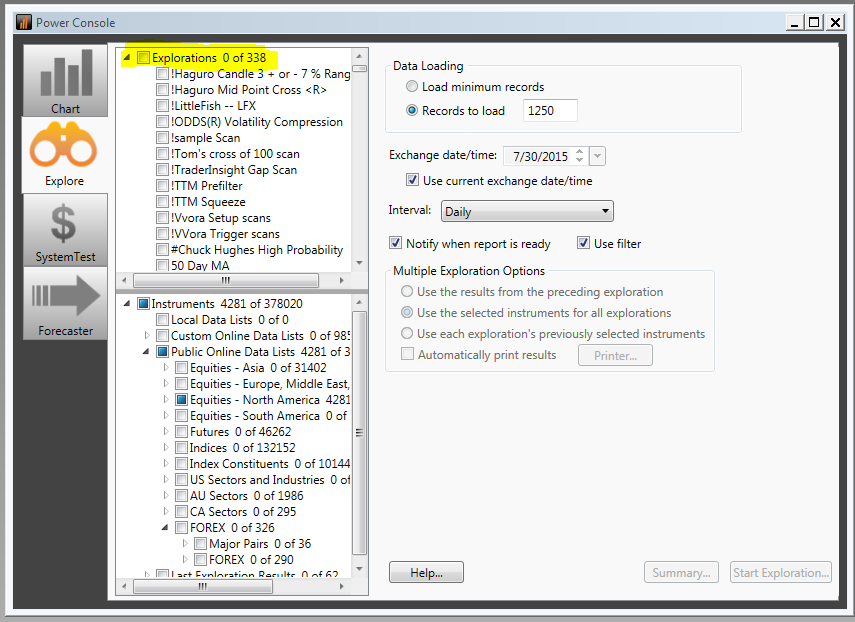
You'll want to start in the Explore tab of the Power console.  On the Explorations tab, you will want to right click and choose "New Exploration."  


This will open up a dialog box that will allow you to create your Exploration.  


The real fields you need to worry about are Name, notes and Filter.  In this case, I've named this as Jeffs Prefilter Exploration.  I expect you to name it whatever you want to.  

I do recommend adding some items in the Notes field as this will make it much easier for you to remember the purpose of your Exploration down the road. 

For the filter column we will look for the close of the security to be above 5 and less than 50 and for the volume to be greater than 250,000.  Of course you can easily change these values to fit your actual trading style.  

The code you'll use is very simple.  You will click on the Filter Tab and choose 

Close > 5 and Close <50 and Volume > 250,000

Once you are done, everything should look similar to your the screen above.  Simply click OK and you are ready to run your new Exploration against the list of your choice.  

I would recommend saving your list when you are done with the exploration.  This way you can just choose to scan the new list with the explorations you normally use.  

If you run into any issues with this, feel free to reach out to our help team.  I get great feedback on our support and you can reach them at www.metastock.com/customer

Happy Trading

Jeffrey Gibby
Head of Business Development

About the author:  

Jeffrey Gibby has been working for MetaStock for over seventeen years. He is currently in charge of global business development and works to create new MetaStock distributors and partners worldwide.
Mr. Gibby works with training companies to help people learn the power of MetaStock. He has spoken to traders from around the world and has trained people on how to use the software and trade various markets. Among his areas of responsibilities are the management of new products and services for MetaStock and creating strategic partnerships.