MetaStock is very excited to announce the release of MetaStock XIII featuring the new MetaStock FORECASTER. This brief video by Scott Brown, president of MetaStock, explains the new features.

Thursday, November 21, 2013


Wednesday, November 13, 2013
TechniTrader Weekly Stock Discussion: “Breakout Pattern Analysis”
MetaStock® SPRS Series - Week 143 – November 1, 2013 - MetaStock Spatial Pattern Recognition Skills Series written by Martha Stokes CMT
American Express Company AXP is the example of a Breakout pattern. AXP has been stuck in a 7 point sideways pattern for several months. It recently broke out to the upside as its earnings report was better than expected. Several aspects of the sideways pattern indicated that this was a stronger sideways pattern with upside potential.
There are many types of sideways price action and identifying each is critical for successful investing and trading. This was not a true Trading Range because it was less than 10 points from peak to trough.
Trading Ranges also tend to have inconsistent highs and lows with plenty of inter range lower peaks or higher lows. This makes trading range bound stocks much more difficult than many people believe.
When a sideways pattern is less than 10 points wide from peak to trough, attempting to trade the range with a SAR, Stochastic, or other Trading Range strategy is substantially more difficult. This is due to far greater risk because of the constant whipsaw action, long wicks and tails, and the inconsistent highs and lows of the range.
However when a pattern forms very consistent highs and lows, and maintains a stable level even when High Frequency Traders enter the stock periodically, then more is going on than is often evident on the surface.
One market participant is capable of controlling price within a consistent high and low range. Their buying patterns maintain price within a narrower range than a true Trading Range pattern.
When studying AXP it is evident that Dark Pools were involved in maintaining the neat, concise appearance of this sideways pattern. This pattern is called a Platform pattern because it is building a base upon which the stock can move upward, with stronger support beneath it when it does move up.
It is common for a stock that compresses as AXP did, to have a breakaway gap form. The breakaway gap leaps over prior highs, establishing a new higher high for the stock. The significance of this move is not just that the company had good earnings but also that the giant funds believe this company is going to continue to have strong growth moving forward.
Most of the time retail traders make the mistake of trying to swing trade these platforms with mediocre to terrible results. The Platform pattern is seldom recognized for what it is, and is often mistaken for a Trading Range or wider sideways pattern.
Being able to recognize the consistent highs and lows of the sideways pattern, can be hugely beneficial as the breakouts occur without much warning.
During a Platform pattern Bollinger Bands may not compress, Stochastic may show a floating pattern or an extreme oversold pattern. So instead of holding the stock to reap the profits of the breakout, the trader exits just before the stock forms a breakaway gap.
Chart analysis requires an understanding of not only price but also which indicators should be used for the current market conditions, trading conditions, and the chart candlestick patterns. Most short term trading losses are due to the following:
- Improper chart analysis
- Using the wrong indicators
- Not being aware of the current Market Condition
- Not recognizing compression patterns within a sideways pattern
- Using the wrong trading style for the chart pattern
- Using the wrong trading strategy
By increasing your ability to read charts and by using proper indicators, trading styles, and strategies your profitability will increase significantly. In addition trading will be easier and much more fun to do.
Watch a technical analysis training video for more information here http://goo.gl/PkzfkF
Trade wisely,
Martha Stokes CMT
Member of Market Technicians Association
Master Rated Technical Analyst for Decisions Unlimited, Inc.
Instructor and Developer of TechniTrader Stock Market Courses
For additional training visit http://technitrader.com
This Stock Discussion and Training Lesson is sponsored by TechniTrader.com
MetaStock® Partner
©2013 Decisions Unlimited, Inc. All Rights Reserved.
TechniTrader is the Registered Trademark of Decisions Unlimited, Inc.
Disclaimer: All statements, whether expressed verbally or in writing are the opinions of TechniTrader and its instructors or employees, and are not to be construed as anything more than an opinion. Student/subscribers are responsible for making their own choices and decisions regarding all purchases or sales of stocks or issues. At no time is any stock or issue on any list written or sent to a student/subscriber by TechniTrader and its employees to be construed as a recommendation to buy or sell any stock or issue. TechniTrader is not a broker or an investment advisor it is strictly an educational service.
TechniTrader Weekly Stock Discussion: “7 Things To Know About Trading IPO’s”
MetaStock® SPRS Series - Week 144 – November 8, 2013 - MetaStock Spatial Pattern Recognition Skills Series written by Martha Stokes CMT
The Facebook IPO has left a nasty after taste for many retail investors and retail traders, who didn’t know what they needed to know about trading or investing in an IPO.
Now with Twitter’s IPO the retail side of the market is shunning this debut.
What makes a great IPO and what dooms other IPOs to failure? Why is WAGE a spectacular IPO from 2012 which TechniTrader Students learned about even before it IPO’d? 
Here are 7 things to know about trading or investing in an IPO, but no one ever tells you.
- Retail investors and retail traders are not the most important investors for a new IPO. Wealthy individuals are not the most important investors, nor are professional traders. The Market Participant that truly matters in terms of the success of an IPO are the Giant and large Buy Side Institutions.
- To follow the Giant Buy Side institutions and to discover which IPO’s they are interested in, and which they are not buying is a simple matter of having the correct indicators that tell you when the Giants are buying. These indicators were written for our modern markets, whereas MACD, Stochastic, and other older indicators do not tell you this vital piece of information.
- The Institutional percentage ownership is important. Facebook had less than 2% institutional ownership in the first several months after it IPO’d, because the Giant funds shunned FB immediately and the collapse of the stock was due mostly to their lack of interest. A good IPO will have anywhere from 40-90% institutional ownership. This is because most smaller lot investors and smaller funds are afraid of investing in an IPO. This is because they do not know what information is needed to make a proper assessment of a young firm, and they listen to gurus and recommendation services that are only trying to dump a lot of IPO stock quickly.
- Revenues and Income matter but a company can have a strong IPO even if it is not making a profit yet, IF it is showing that it can make a profit within a quarter or couple of quarters. Giant institutions are long term investors and they will buy into a young firm ahead of strong earnings reports. They can tell when a company has what it takes to succeed.
- Find the Platforms. Quiet accumulation is a very distinct pattern on charts. Candlesticks form in a blocky tight formation with consistent highs and lows. This is due to the specialized order that the Giant Funds use regularly on Dark Pools. This specialized bracketed order is what keeps price in a Platform sideways pattern. This is a newer sideways pattern that first started showing up in charts less than a decade ago. It is a vital piece of chart analysis for retail investors and traders because it tells you if quiet accumulation is occurring. Giant Buy Side institutions keep their investments very private and do not reveal their holdings until they are required to do so quarterly. Only on stock charts can you quickly see what they are buying ahead of the quarterly reports.
- Company management is important to a new firm. It doesn’t matter how big a company is but how well it is managed. Facebook had several issues including too many private investors, nearly 500. Also there were too many private investors and insiders wanting to sell too early weakening the opinion of Facebook. The CEO and Board of Directors can make or break an IPO. It is not just the underwriter who must present the company.
- Shares offered at the Initial Public Offering. One of the biggest warning flags for Facebook was its enormous offering of shares. It was far too huge an offering for a good, strong IPO. Most great IPOs that launch and run like LNKD, WAGE, and others had small outstanding shares. What this does is it creates a strong supply versus demand equation for the stock which keeps the stock moving upward.
There are many simple ways to decide is an IPO is going to do well or not, but you won’t find this information in any commentary or guru recommendation. Understanding the internal dynamics of the market is where the true information you need resides.
For more information how to track the giant funds who use Dark Pools watch "Stock Indicators Online Training Video" at http://goo.gl/6NRQe9
Trade wisely,
Martha Stokes CMT
Member of Market Technicians Association
Master Rated Technical Analyst for Decisions Unlimited, Inc.
Instructor and Developer of TechniTrader Stock Market Courses
For additional training visit http://technitrader.com
This Stock Discussion and Training Lesson is sponsored by TechniTrader.com
MetaStock® Partner
©2013 Decisions Unlimited, Inc. All Rights Reserved.
TechniTrader is the Registered Trademark of Decisions Unlimited, Inc.
Disclaimer: All statements, whether expressed verbally or in writing are the opinions of TechniTrader and its instructors or employees, and are not to be construed as anything more than an opinion. Student/subscribers are responsible for making their own choices and decisions regarding all purchases or sales of stocks or issues. At no time is any stock or issue on any list written or sent to a student/subscriber by TechniTrader and its employees to be construed as a recommendation to buy or sell any stock or issue. TechniTrader is not a broker or an investment advisor it is strictly an educational service.
Friday, November 1, 2013
Support Tip: MetaStock Monitor SEPTEMBER- OCTOBER 13
HOW CAN I SEARCH FOR SECURITIES BASED ON FUNDAMENTAL DATA?
MetaStock can only screen securities based on price data and price based indicators. However,
MetaStock Professional, through the XENITH program can search for and screen stocks
based on a much more diverse set of criteria. To do this:
1. Open XENITH.
2. Look at top left and find the blue icon that shows a magnifying glass over a page (Advanced
Search).
3. Click the icon and then select Equites -> Companies
4. The Companies Search screen will open.
5. In the bottom left, click the Add Criteria button.
6. Select the desired fundamental data from the list
7. A new line will be added to the search screen and you can enter the requirements for that data
value.
8. Add as many other criteria as desired and then click Search.
MetaStock can only screen securities based on price data and price based indicators. However,
MetaStock Professional, through the XENITH program can search for and screen stocks
based on a much more diverse set of criteria. To do this:
1. Open XENITH.
2. Look at top left and find the blue icon that shows a magnifying glass over a page (Advanced
Search).
3. Click the icon and then select Equites -> Companies
4. The Companies Search screen will open.
5. In the bottom left, click the Add Criteria button.
6. Select the desired fundamental data from the list
7. A new line will be added to the search screen and you can enter the requirements for that data
value.
8. Add as many other criteria as desired and then click Search.
Slauson's Slant: MetaStock Monitor SEPTEMBER - OCTOBER 13
The Starving Artist - Contributed by John Slauson
One of the biggest challenges in developing a trading systems is being precise when defining the rules. Technical analysis is often criticized because many of its adherents are so ambiguous with their methodology. So ambiguous in fact that it becomes impossible to validate their “system” using any semblance of scientific methods. This is convenient for the trading system peddler, but frustrating for the trader. Among technicians, the well worn adage “the trend is your friend” is sadly second only to “technical analysis is an art not a science.” The latter is a euphemism for: “I have a system that works super awesome...except when it doesn’t.”
Some examples of ambiguous trading rules I often hear:
Prices should move slightly above….
Volatility can increase a bit….
Place the stop just above a recent high…
Prices should cross above the moving average on big volume...
Prices will reverse at about the same price level several times…
The trend must be steeply up over the short-term…
The black candlestick must be significantly larger than the preceding white candlestick…
To move technical analysis out of the realm of art and into the realm of science, ambiguous words like the ones in bolded italics must be eliminated and replaced with precise, quantifiable values.
Of all the tools used by technicians, support and resistance is perhaps the most difficult to quantify. Ask 10 traders to draw support and resistance lines on the same chart and you’ll see lines drawn at almost every price level Years ago I developed a scoring method to help traders quantify support and resistance levels. I presented this method at a conference sponsored by Golden Gate University. In attendance was W.H.C. Bassetti, editor and coauthor of the classic book, Technical Analysis of Stock Trends first written by Robert D. Edwards and John Magee in 1948. Bassetti referenced my scoring method and the MetaStock Add-on based on it (PowerStrike), in the 9th edition of his book.
The methodology I presented for measuring support and resistance is based on three phenomenon in the stock market:
1. Humans prefer “easily” divisible and memorable numbers (e.g.,
“20” is preferred over “19”). These values are typical of option
strike prices. Hence many traders' attention is drawn to these
numbers providing the potential for even more "concentrated"
buying and selling.
2. Stock prices are heavily influenced by trading near option strike
price levels. Hence, these levels greatly influence where
"important" buying and selling occur. Support and resistance is
based on the concentrated buying and selling. Option Strike
Price levels attract more attention from important market
participants over other price levels.
3. Bullish and Bearish pressures at Option Strike Price levels
resolve more quickly than pressures at other levels.
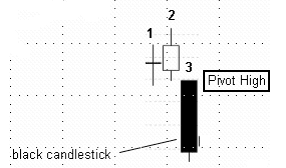
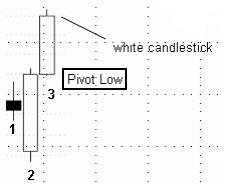
With these general principles in mind, I developed a tool that scored the strength of support and resistance on optionable US stocks. The heart of the scoring method revolves around three bar pivot highs and three bar pivot lows. A value of 1, 3 o 5 points is assigned to a pivot high or low based on the volume associated with bars 1 and 3 of the pattern.
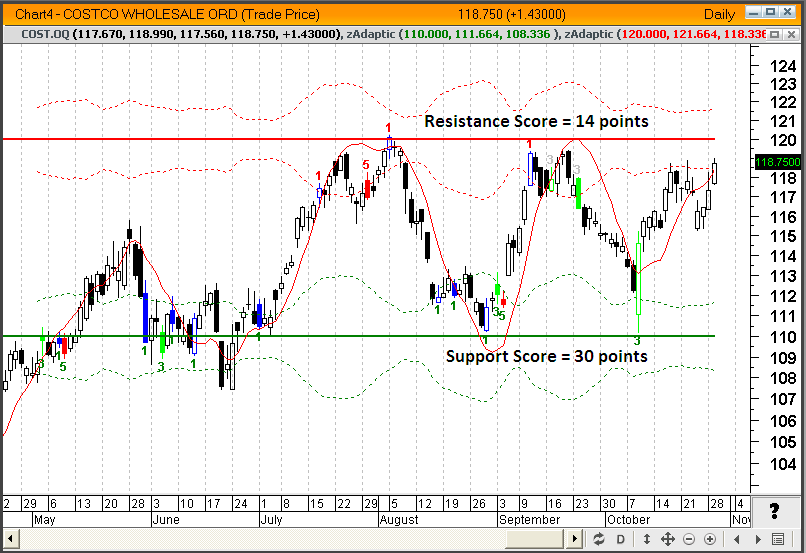
To be counted in the score a pivot highs or lows has to form within a specified distance (based on precise volatility bands) from an option strike price. Totaling these values provides a specific score for the support or resistance level being measured. The score can then easily be used independently or incorporated into a larger set of trading rules. It can even be backtested, an important litmus test for a valid trading method.
The following chart of Costco illustrates this scoring system. Pivots highs that occurred near the 120 strike price totaled 14. Pivot lows near the 110 strike price totaled 30. “Near” is precisely defined as pivot highs and lows that form within the volatility bands drawn at each level. From this we can objectively state that support at
$110 is stronger than resistance at $120.
My point in presenting this scoring method is not to sell you on this specific method of identifying support and resistance; it is simply to illustrate that it is possible to take the ambiguity and “art” out of technical analysis, even something as subjective and seemingly imprecise as support and resistance. Do this and you may avoid becoming a “starving artist.”
Power User Tip: MetaStock Monitor SEPTEMBER - OCTOBER 13
MetaStock Power User Tip
Using Excel with XENITH
Contributed by Breakaway Training Solutions
In this short video, I'll give you a couple of quick tips on how to get your real-time data from XENITH into an Excel spreadsheet.
For more MetaStock training, make sure to visit Breakaway Training Solutions at www.learnmetastock.com or email Breakaway Training Solutions at admin@breakawayts.com.
About Kevin Nelson
Kevin Nelson is the founder of Breakaway Training Solutions, Inc. He has spent the last 17 years becoming an expert on MetaStock software and a serious student of technical analysis while working for MetaStock. Prior to joining MetaStock in 1993, Kevin was a stockbroker for a well-known NYSE firm. In his role as Sales Manager at MetaStock, Kevin interacted extensively with MetaStock customers via phone, webinars, and public appearances. His experiences while working at MetaStock have enabled him to gain a keen understanding of the needs of technical analysts worldwide. While with MetaStock, Mr. Nelson was a featured presenter for four years. During this time, he traveled the U.S. introducing the MetaStock program to thousands of people and teaching them how to use its many features. His easy-to-understand approach is considered by many to be the best in the industry.
Monday, October 28, 2013
TechniTrader Weekly Stock Discussion: “5 Tips for Higher Swing Trading Profits”
MetaStock® SPRS Series - Week 142 – October 25, 2013 - MetaStock Spatial Pattern Recognition Skills Series written by Martha Stokes CMT
Swing Trading is a very popular short term trading style used by retail traders and professional traders.
It is far superior to Day Trading in every way, and here are 5 reasons why:
- Lower costs to set up and maintain your trading system and platform.
- Lower capital and experience requirements from online brokers.
- Less time needed to make significantly higher profits per month.
- Flexible work hours and less effort to manage open held stocks.
- Less stress and much more fun to do.
Swing trading depends primarily on the analysis of the stock chart, and recognizing specific candlestick patterns that indicate a momentum or velocity price action is about to start.
In order to be highly successful at Swing Trading, you need to find the right price candlestick patterns on your stock charts that will be ideal Swing Trades. Just picking any old stock, a recommended stock, or a stock in the news is NOT going to be the best method for choosing a Swing Trade stock pick.
Here are 5 Tips on how to read a stock chart and decide if it is suitable for Swing Trading:
- REPETIVE CANDLESTICK PATTERNS that yield consistent Swing Trading runs that are profitable. When you find a chart with candlestick patterns that repeat regularly, this gives you a means of anticipating AND recognizing a similar setup for the next Entry before the Swing Trade run begins.
- PRICE LEVELS are most important for Swing Traders. Sure, any price level can have a momentum or velocity run, but for Swing Trading it is also about being in with the professional Swing Traders that track the Dark Pool giant lot funds managers. By trading with the pros you have a significantly better profitability ratio and far more consistent runs. Lower priced stocks are generally the realm of smaller lot uninformed traders. Extremely high priced stocks are the realm of retail day traders or options traders.
- FOLLOW THE GIANT FUNDS MONEY PLACEMENT. The giant Buy Side funds control trillions of dollars of mutual fund and pension fund investors. The stocks they are buying are strong candidates for Swing Trading because these stocks have companies with improving fundamentals or expanding growth potential, or both. By tracking the giant funds via TechniTrader Quiet Accumulation TTQA Indicator as example, retail traders know that this company has stronger fundamentals and is poised for growth. A company that is growing will have periodic momentum and velocity moves due to surprise Earnings, sudden great news, and High Frequency Trader HFT triggered buying activity.
- KNOW THE DIFFERENCE between a Momentum run and a Velocity run. The Velocity run is faster moving, gaining more volume energy and buying speculation. This type of run requires a completely different trailing Profit Stop position to keep you in the stock while protecting profits, from the inevitable profit taking the professional traders will begin at some point. A Momentum run will last much longer but has rests frequently. The Stop Loss for a Momentum run needs to allow for the natural pausing, resting, and small indecisive price action days to keep you in the trade until the Momentum energy is exhausting.
- ENTRIES AND EXITS for Swing Trading must be precise, deliberate, and well planned. Just jumping in because a stock has started to run is the best way to lose money on a Swing Trade. Using a pre calculated Entry that buys into strength instead of the traditional Limit Order so many retail traders use, is crucial to successful Swing Trading. Never buy into weakness using a Limit Order. Using a Limit Order is one of the most common reasons Swing Traders do not have consistent profitability.
When you combine professional style Repetitive Patterns, Price Levels, Indicators, Stop Loss placement, Entries and Exits your Swing Trading will go to a whole new level of profitability. It will be easier, more reliable and a lot of fun to do.
For more information here is a link for Candlestick Patterns
Trade wisely,
Martha Stokes CMT
Member of Market Technicians Association
Master Rated Technical Analyst for Decisions Unlimited, Inc.
Instructor and Developer of TechniTrader Stock Market Courses
For additional training visit http://technitrader.com
This Stock Discussion and Training Lesson is sponsored by TechniTrader.com
MetaStock® Partner
©2013 Decisions Unlimited, Inc. All Rights Reserved.
TechniTrader is the Registered Trademark of Decisions Unlimited, Inc.
Disclaimer: All statements, whether expressed verbally or in writing are the opinions of TechniTrader and its instructors or employees, and are not to be construed as anything more than an opinion. Student/subscribers are responsible for making their own choices and decisions regarding all purchases or sales of stocks or issues. At no time is any stock or issue on any list written or sent to a student/subscriber by TechniTrader and its employees to be construed as a recommendation to buy or sell any stock or issue. TechniTrader is not a broker or an investment advisor it is strictly an educational service.
Subscribe to:
Posts (Atom)