Friday, April 25, 2014

TechniTrader Weekly Stock Discussion for MetaStock “SNDK Why it Gapped Up” by Martha Stokes CMT

MetaStock® SPRS Series - Week 168 – April 25, 2014 - MetaStock Spatial Pattern Recognition Skills Series written by Martha Stokes CMT


SNDK has been a stock in mentoring notes for TechniTrader Students since 2012 when it first came out of its trading range low. The Weekly Chart below shows a steady rise with periodic platforms as it moved up.  


A Daily Chart shows consistent highs and lows of a classic platform sideways pattern. Platforms are a fairly new sideways pattern, due to the giant lot institutional orders that control price in a very specific range and pattern.
SNDK looked as if it was forming a top just a few days before it was set to release its earnings.  Prior to the earnings release with occurred on the day of the gap, smaller lots attempted to sell short this stock, moving price down to the prior buy zone of the giant lots.  This triggered giant lot automated orders which then triggered a High Frequency Trading HFT gap up at open on the news.
Many times smaller lot traders are on the opposite side of the trade when giant lots who are using Dark or Twilight Pools.  Since intraday real time doesn’t reveal the Dark Pools, the smaller lot traders can often make the mistake of taking a position against the giant lots.
This is a major reason why day and intraday trading has become more difficult for smaller lot traders. It is especially true for small lot traders who use price indicators instead of volume, uptick versus downtick quantity, and accumulation/distribution quantity indicators.
One of the common misunderstandings regarding Dark Pool activity is that most traders assume that such huge lots will move price. The opposite is true. Since they have custom orders designed specifically for their style of buying and selling with the goal of NOT moving price, price indicators fail to reveal Dark Pool quiet accumulation.  If the volume and quantity indicators and the new fundamental chart indicators had shown distribution patterns, then the move down would have been wise given the sell side bias and sentiment of the past few weeks. However, there was no indication during the prior 3 months of any rotation aka the lowering of held shares and no distribution.
Once the news came out before market open, HFT orders started filling the queues.  HFTs use smaller order sizes but the number of orders 1000-3000 per second, creates extreme volume surges that can gap a stock several points in less than a second.  The gap was not a break away gap however, as it did not clear the prior resistance. SNDK did have excellent earnings and revenues for its first quarter.

Summary
Earnings Season provides plenty of opportunities for traders of all styles and disciplines. Understanding what causes the price patterns the 2-3 months prior to an earnings season is critical to success.
For information on Candlestick Patterns go to CLICK HERE
Trade wisely,
Martha Stokes CMT
Chartered Market Technician
Member of Market Technicians Association
Master Rated Technical Analyst for Decisions Unlimited, Inc.
Instructor and Developer of TechniTrader Stock Market Courses
For additional training visit http://technitrader.com
This Stock Discussion and Training Lesson is sponsored by TechniTrader.com
MetaStock® Partner


©2014 Decisions Unlimited, Inc.  All Rights Reserved.
TechniTrader is the Registered Trademark of Decisions Unlimited, Inc.


Disclaimer: All statements, whether expressed verbally or in writing are the opinions of TechniTrader and its instructors or employees, and are not to be construed as anything more than an opinion. Student/subscribers are responsible for making their own choices and decisions regarding all purchases or sales of stocks or issues.  At no time is any stock or issue on any list written or sent to a student/subscriber by TechniTrader and its employees to be construed as a recommendation to buy or sell any stock or issue. TechniTrader is not a broker or an investment advisor it is strictly an educational service.

Wednesday, April 23, 2014

Using EcoStat with MetaStock XIII

Forecaster has (rightfully) been getting a lot of attention with MetaStock XIII.

While it has been hogging the attention, quite a few new features have been overlooked.  In this little article, I'll explain how to access EcoStat and what it is.

EcoStat is a really big tool, included in MetaStock Professional XIII for free that gives you a ton of information on 11 major countries.  Our Forex traders love it for looking at broad economic data.

By the Numbers Ecostat consist of:
  • 78 layouts covering a broad selection of economic data on 11 major countries.  
  • Economic analysis on 11 major countries including:  US, UK, Canada, France, Germany, Italy, Japan, Australia, Russia, China, and Brazil.
  • Leverages the extensive set of economic data provided with the XENITH datafeed.
  • Popular economic data including inflation indicators, foreign trade, GDP, debt, monetary, housing, unemployment, leading indexes, and more.
Helpful guidance for the implications that economic conditions have for stock, commodity and bond traders.

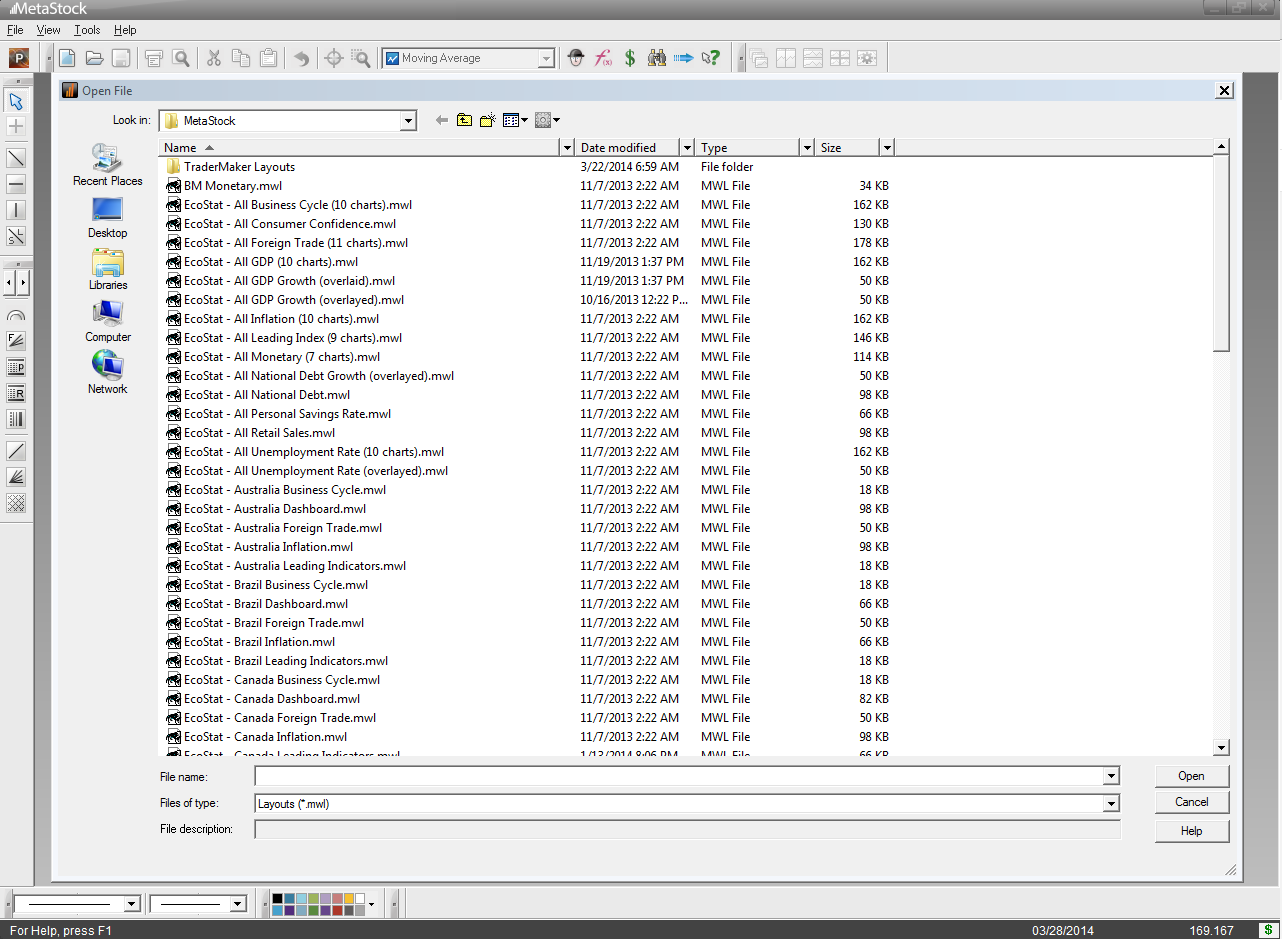
To Access it you would open any of these Layouts from the File|Open menu in XIII. Here you will have a great selection of data available as shown in this image:


I particularly find it interesting to look at the Overlayed charts. Personally, I was surprised to see who is first in National Debt.


This offers a lot of really good Macroeconomic data and I particularly like the Dashboard views.

By the way, If you're a fan of this type of top down Analysis, you should also take a closer look at Sector Stat which is also included free of charge with MetaStock and MetaStock Pro.


Tuesday, April 22, 2014

Employee Spotlight: Kristen R

Name:   Kristen R
Time with Company:   July 2000 to Feb 2012  July 2013 to present
Area of company works in:   Quality Assurance
Do you trade in your spare time: Beginning to now after all of these years
Favorite part of your job:  Finding and solving difficult Bugs in the software
Favorite Quote:  "Perfect is the enemy of good"
Favorite Color:  Mint Green
If you weren't working with MetaStock what would you want to be doing:  Opening my own Authentic Italian Restaurant

Thursday, April 17, 2014

TechniTrader Weekly Stock Discussion “Technical Traders vs Fundamental Traders” by Martha Stokes CMT

MetaStock® SPRS Series - Week 167 – April 18, 2014 - MetaStock Spatial Pattern Recognition Skills Series written by Martha Stokes CMT  


Many times technical traders, those who use technical and stock chart analysis exclusively are baffled by how a stock chart reacts to news, support or resistance, or major index down days.  It seems as if the stock is not behaving technically as it should.
What technical traders fail to understand is that chart analysis is a window into the world of fundamentalist mindset.  There are far more traders in the market who are fundamentalists or use quantitative research for their stock pick selection than there are technical traders.
Since most technical traders are from the retail side aka the everyday average investor/trader, it seems inconceivable to them that someone would not use technical analysis. However in recent survey of over 50 smaller funds in the San Francisco area, none used technical analysis and only 2 were interested in learning how to use it.
This is a common theme among the fundamentally based smaller funds groups.  It is unfortunate because those funds that do employ not only fundamental, quantitative, and risk analysis but also use technical analysis have a far higher Rate Of Investment ROI than those merely using fundamental and quantitative analysis formulations.
Nowadays it is far easier to incorporated more data into the stock chart than ever before.  Some charting programs now have critical fundamental data incorporated into the charts, allowing you to use this information along with pure technical analysis.
Just as when fundamentalist use more of the 4 major analyses in their final decision making process, so too when a technical trader uses some basic fundamentals profitability increases significantly without adding more workload or time.
A quick way to add crucial fundamentals to stock charts is to use fundamental indicators. These can be technical indicators based on fundamental data such as quantity uptick/downtick formulation which separates out the large lots from the smaller lots, to line indicators using fundamental data.
Employing accumulation quantity volume oscillators and TechniTrader Flow of Funds TTFF indicators  reveals when institutional interest is rising.


The ability to incorporate not only technical analysis in your stock charts but also vital fundamental data, quantitative analysis, and risk analysis means that your stock charts are working harder for you and you are working less with better and more complete analytics, more information that is easy to interpret, and a superior method of interpreting what price will do next.
Professionals enjoy a 90% rate consistently. This is due to the fact that they use the best tools they can find and are willing to pay for those tools, to gain the enormous advantage that superior tools will give them.
Retail traders often pinch pennies and throw away dollars by trying to get by with a free charting software on the internet, that doesn’t have even a fraction of the tools needed to be consistently successful.
Professionals and semi-professional traders are all going to be using these new tools that incorporate not only technical analysis but also fundamental data indicators, quantitative analytics in scans and sorts, risk analysis, with assessment and evaluation all within the charts.  
All traders need to consider if they are just doing trading for fun, as a hobby, OR If they are truly serious about becoming consistently successful and making money from stocks or other trading instruments.
If you want to be a member of the professional or semi-professional traders who earn high income, then start with your charting software.  Incorporate as much of the 4 analytics as possible in your charts.
For information on “Retirement Investing - The New Fundamentals” go to http://goo.gl/pnN5Vb
Trade wisely,
Martha Stokes CMT
Chartered Market Technician
Member of Market Technicians Association
Master Rated Technical Analyst for Decisions Unlimited, Inc.
Instructor and Developer of TechniTrader Stock Market Courses
For additional training visit http://technitrader.com
This Stock Discussion and Training Lesson is sponsored by TechniTrader.com
MetaStock® Partner


©2014 Decisions Unlimited, Inc.  All Rights Reserved.
TechniTrader is the Registered Trademark of Decisions Unlimited, Inc.


Disclaimer: All statements, whether expressed verbally or in writing are the opinions of TechniTrader and its instructors or employees, and are not to be construed as anything more than an opinion. Student/subscribers are responsible for making their own choices and decisions regarding all purchases or sales of stocks or issues.  At no time is any stock or issue on any list written or sent to a student/subscriber by TechniTrader and its employees to be construed as a recommendation to buy or sell any stock or issue. TechniTrader is not a broker or an investment advisor it is strictly an educational service.

Friday, April 11, 2014

TechniTrader Weekly Stock Discussion for MetaStock “5 Tips to Avoid Front Running by High Frequency Traders HFTs”

MetaStock® SPRS Series - Week 166 – April 11, 2014 - MetaStock Spatial Pattern Recognition Skills Series written by Martha Stokes CMT

The new Flash Boys book has captured the imagination of everyone who invests or trades in the stock market. The fear that the market is “rigged” is everywhere.  The CEO of IEX is of course hoping his new exchange will benefit from all the news media hype and panic.
However, most investors and retail traders do not need to worry.  If your investments for your long term portfolio are with a large to giant mutual fund or pension fund, then these funds are using Dark Pools which are off the exchange transaction the HFTs can’t see and front run.
If you are a retail trader, remember that most of the orders placed with online brokers for retail traders are filled from that online broker inventory. So your orders never make it to the exchanges. If you are using an Electronic Communication Network ECN, most of those orders are not sent to the exchanges either.
Here are 5 Tips to Avoid Front Running by HFTs:
  1. Study your stock charts using volume large lot accumulation/distribution indicators.  These are uptick/downtick based indicators that track the larger lot meaning 50,000 – 500,000 shares, against the smaller lots which are usually 100 shares to as high as 5000 shares. Entering with the giant buying keeps you out of the HFT order flow, because the Dark Pool orders are hidden from HFTs.
  2. Remember that any order 10,000 shares and above is considered a “Large Lot” order and these tend to be sent more often to exchanges if inventories for your online broker are too low.
  3. If you are a day trader, you must accept that HFT activity is going to interfere with your trading. There is just no way of getting around it intraday. HFTs trade 1000-3000 times per second, YOU can only trade on the minute scale by law and by circumstance. Most retail traders could not afford a million dollar HFT trading setup of hardware and software.
  4. Do not use “At Market Orders.” An At Market order tells your broker to fill the order at the market price.  This can set up an opportunity for slippage and wider spreads which will give you a higher cost entry. In addition, At Market Orders send a message to the online broker and market in general that you are not an educated, experienced investor or trader.  At Market Orders are rarely used by experts and professionals. There are only rare specific purposes for such orders.
  5. Do not use a simple “Limit Order.”  Limit orders are the most common reason why retail traders, especially day and swing traders have constant losses.  Professionals stopped using Limit Orders years ago and have switched to more complex, multi-tiered controlled bracketed orders. You need to learn these new types of orders if you plan to swing or day trade so that you can avoid getting swept into an HFT downdraft or huge gap.

The charts below show HFT activity.  Huge HFT activity is usually a one day event in a stock based on news, arbitrage from another market or instrument, hedging, retail cluster orders caused by retail traders all using the same trading systems, strategies, MACD or Stochastic indicators, and some technical set ups.  One of the huge advantages you as a retail trader using technical analysis and stock charts is that you can see the activity of the HFT, Dark Pool, Smaller Fund, Corporate Buybacks, and many more patterns that tell you who is controlling price and thus how price will behave thereafter.
One final tip is that HFTs rarely shift the trend, so do not start selling short right after a huge HFT down day. C:\Users\Adrienne\Desktop\TechniTrader HFT Example.jpg
Above chart shows two HFT high volume and long candles.  The first attempted to drive price up but the stock did not alter its trend. The second tried to drive price down, but the bottom buy zone for Dark Pools had already been reached. The stock then commences a sideways action of an early bottoming pattern.C:\Users\Adrienne\Desktop\TechniTrader HFT #2 example.jpg
Chart above shows HFTs attempting to drive price up but the price quickly shifts sideways and then turns down again. HFT action did not reverse the down trend in the month of February.
Summary
Do not chase HFT activity, instead learn to enter before the HFT moves price. Learn how to interpret the stock and volume action to know when quiet accumulation is occurring, so you can buy into the stock before the big moves of the HFTs.
For information on Candlestick Patterns CLICK HERE
Trade wisely,
Martha Stokes CMT
Chartered Market Technician
Member of Market Technicians Association
Master Rated Technical Analyst for Decisions Unlimited, Inc.
Instructor and Developer of TechniTrader Stock Market Courses
For additional training visit http://technitrader.com
This Stock Discussion and Training Lesson is sponsored by TechniTrader.com
MetaStock® Partner

©2014 Decisions Unlimited, Inc.  All Rights Reserved.
TechniTrader is the Registered Trademark of Decisions Unlimited, Inc.

Disclaimer: All statements, whether expressed verbally or in writing are the opinions of TechniTrader and its instructors or employees, and are not to be construed as anything more than an opinion. Student/subscribers are responsible for making their own choices and decisions regarding all purchases or sales of stocks or issues.  At no time is any stock or issue on any list written or sent to a student/subscriber by TechniTrader and its employees to be construed as a recommendation to buy or sell any stock or issue. TechniTrader is not a broker or an investment advisor it is strictly an educational service.


Monday, April 7, 2014

May the Math be Ever in your Favor

I have occasionally seen trading system ideas that I feel incorporate unnecessary risks.  I'm not saying the signal will not work, but rather, there is an element of randomness to them.
It is common to build systems that look for one or more indicators crossing above or below the prices or some other indicator.  However, sometimes such a system may look good but have a hidden vulnerability.  Consider the chart below: 


Willilam's %R and the Chaiken Money Flow(CMF) are common indicators.  Normally, they are used separately, however, if we overlay the CMF in the plot of the Williams %R, it looks like we have found a good signal:


Notice how the Williams %R seems to cross above the CMF at the start of up moves.  The opposite signal does not seem as good as it is sometimes delayed.  However, the chart above shows two long signals that should be profitable and a third that could have made money depending on the exit signal.  But is this really a good system?

Formulas require a mathematical test to find buy and sell signals.  The possible signals above are easily seen, but mathematically, the systems did not cross.  Here is the same chart with the indicators merged to use the same scale:


The CMF is essentially a flat line compared to the Williams %R.  Additionally, it's never really  very far from the zero line.

There are some calculations that try and normalize the scales of the two indicators. However, this logic is only accurate for the last bar displayed on the screen.  It also requires an exact specification of how many bars are visible in the chart.  This means any signals you get may not match what you see in your chart.  Consider the following two charts:


Both show the overlaid indicators for the Months of October and November.  The top chart shows data up to November 22nd.  The Williams %R is firmly below the CMF but has just risen to touch it for the second time.  The second chart adds another 8 days of data.  Now the CMF hugs the Williams %R, even whipsawing above it on November 4th.  It also shows a buy signal on 22 November that we did not take because it was not there on that date.

Sometimes a system that is overlaying indicators can resolve the math issue with a minor change to one of the indicators.  For example, the Williams %R usually plots in the -100 to 0 range.  If you add a constant to this, you can shift the range.  For example, adding 100 to the Williams %R will change the scale from -100 to 0 to 0 to +100.  The shape of the curve is the same but the values have been shifted.

In the chart below, I created a custom formula to add 50 to the Williams %R.  This shifts the scale so it is centered on the zero line like the CMF.  I also multiplied the CMF by 100 so it will have more visible swings when compared to the Williams %R:


The other advantage is that this will not change.  The value for any given bar will always be the same.  When the scales are fixed and not subject to the whims of zoom settings, it will remove one more chance for a trade to go against you.  Keep the math in your favor and your trading should be better.