Micron Technology (NASDAQ:MU) – Regression Line Analysis
By Martha Stokes CMT
Choosing the right indicators for trading is often a daunting task for many new and beginning traders. There are over 200 stock and index indicators to select from and many charting programs have long lists with minimal instructions on how to set the time periods, when to use the indicator, what it was intended to indicate, and whether it is for short-term trading or long-term analysis.
Swing traders should be using different indicators and period settings than what a position trader would use. Swing traders depend upon momentum for short-term price action that they ride up for a few days. Position traders use the slower sideways price pattern called a platform to enter at a lower risk level and then allow the stock to move up over several weeks to months, earning higher profits with lower risk.
If a swing trader is using the wrong indicators, and most technical swing traders use the wrong indicators, then their profitability diminishes substantially.
One indicator that is useful in assessing whether a stock is still trending up or has shifted to a sideways pattern, before it is clearly evident in price action, is the Linear Regression Lines. These are straight lines that are based on the current close or last price to X number of periods ago.
By using a short Regression Line over a Longer regression Line, technical traders can see several important aspects of a stock’s price action that are not easily seen using moving averages or other common indicators.
Patterns that Linear Regression Lines show:
- The angle of ascent or descent of the intermediate-term trend.
- The angle of ascent or descent of the short-term trend.
- Whether or not the short-term trend or intermediate-term trend is moving at a steeper angle.
- Whether the two trends are angling up similarly or diverging.
- Converging and diverging patterns indicating that one trend has shifted over the other.
In the MU stock chart below:
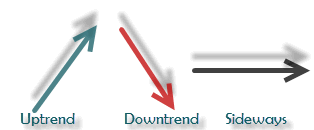
The Regression Lines show that the short-term trend is moving more slowly than the intermediate-term trend. In other words, the short-term trend is sideways whereas the intermediate-term trend is still technically trending upward. The angle of ascent for the intermediate-term trend has become too steep to sustain. This means that the short-term trend is starting to pattern out the excessive speculation in the stock’s price by slowing down its ascent and moving in a sideways platforming pattern. This is a very common pattern that is often missed by swing traders and position traders.
Unfortunately, if a swing trader attempted to trade this stock on a swing trade, the result would be a whipsaw trade that might result in a loss after all expenses were considered. The runs are weak and do not sustain adequately for a strong momentum run during this platforming phase. Retracements occur frequently but do not move the price down sufficiently for selling short either. The sideways pattern is too tight for swing trading.
Summary:
There are many different types of indicators a technical trader can use. Selecting the right indicators that will help you become a more profitable trader can be a daunting task. What is most important to remember about choosing indicators is:
The most popular indicators are the ones that are used in high-frequency trading, HFT, technical algorithms that are searching for cluster order flow from retail traders.
The HFT order triggers on the millisecond and can front-run traders who are using trading systems or technical stock indicators that are overused and very popular. In addition, many of the popular indicators were written decades ago, for an entirely different stock market structure and are no longer as useful as they once were. Traders need to consider using the modern leading indicators, hybrid indicators, and large-lot indicators that can reveal where Dark Pool buying or selling is occurring. By using modern indicators, a retail trader can dramatically improve their profitability.
Trade Wisely,
Martha Stokes CMT
Chartered Market Technician
Master Rated Technical Analyst: Decisions Unlimited, Inc.
Instructor & Developer of TechniTrader Stock Market Courses
MetaStock® Partner
© 2014 TechniTrader®. All rights reserved.
Disclaimer: All statements are the opinions of TechniTrader, its instructors and/or employees, and are not to be construed as anything more than an opinion. TechniTrader is not a broker or an investment advisor; it is strictly an educational service. There is risk in trading financial assets and derivatives. Due diligence is required for any investment. It should not be assumed that the methods or techniques presented cannot result in losses. Examples presented are for educational purposes only.


