Friday, June 13, 2014

Understanding Price action in Short-Term Bottoms: ALXN by Martha Stokes CMT


A short-term bottom is defined as a bottom that tends to complete over a 3- to 5-month period. Sometimes these short-term corrections form more quickly in as little as one month.

Many times, swing and position traders miss out on the wonderful opportunities that short-term bottoms create. Short-term bottoms are often full of momentum energy and can move quickly out of the base. New bottom formations are developing in our electronic marketplace due to Dark Pool trading venues, HFT action chasing Dark Pools, and the new array of orders that are available for each different market participant group.

Learning to identify the patterns of price, quantity, and consistency of volume is the first step to finding excellent momentum trades out of short-term bottoms. Recognizing the new bottoming patterns early on, before the bottom completes, helps position traders see precisely where the bottom is going to most likely complete, which is the ideal entry level for low-risk position trade entries.

A Position Trade is a trade that is held anywhere from 2 weeks to several months. This style of trading is becoming more and more popular as the next generation of traders and investors start learning about the stock market. Since these younger traders are still working, with careers and young families taking a lot of their time, their time constraints require a much simpler, lower-risk entry that generates excellent profits over several weeks to several months.  You can position trade using stocks or you can trade position using options. Both work remarkably well for the busy person who only as a couple of hours a week to trade.

Alexion Pharmaceuticals (NASDAQ: ALXN) is a fine example of just how quickly a short-term bottom can complete.

The Top is one of the newer Top Formations not taught in the older technical analysis books. It rises out of a gap on lower volume. The stock has a flat consolidation before breaking to the downside. If you look at the Volume Bars, you can see why. The volume indicates the gap was created by High Frequency Trading front-running on news for this stock, so this is a gap that is at risk of filling. The top rounds quickly and then HFTs cause another huge black candle on spiking volume again. Since many of the smaller funds chase HFT action by accident, using the wrong type of order which triggers AFTER an HFT volume event, this top was fairly easy to anticipate. The result was the gap filled and then some, moving deep into the prior sideways action before finding support. Quiet accumulation halted the downtrend quickly, and the stock has steadily moved up since then with more strength to the buy side with white candles and volume. TT Quiet Accumulation (TTQA) is shifting sentiment from selling to accumulation.


Looking at TT Volume Accumulation (TTVA), the volume oscillator that compares large lots versus smaller lots and exposes the consistent quiet accumulation volume patterns, we can see that it steadily rose from the HFT volume spike that started the correction. It is obvious by studying the volume and large-lot indicators that Dark Pools were entering during the correction and halted the correction to resume the uptrend. This kind of indicator information is vital to understanding whether a stock is going to continue moving down, stop and start a bottom, or suddenly move with strong momentum.

Learning to read these indicators is easy and fun. Quickly finding stocks is all about using modern leading indicators that give you time to prepare and plan your entries for optimal profits, the lowest risk, and the most enjoyable trading experience.

Most traders are chasing stocks, frustrated, stressed-out, and trying to nibble a couple of pennies from trading. This makes trading hard, extremely stressful and emotional. And it increases risk and lowers profits.

Learn to trade with leading indicators that take the guesswork and stress out of trading.

Short-term bottoms confirmed with leading volume-based indicators are stock chart patterns that can help you prepare early for strong entries and they’re everywhere right now with stock prices recovering from the recent correction.

Learn more about TTQA, TTVA, and other leading hybrid indicators in this video.
 
Trade wisely,
Martha Stokes CMT


Chartered Market Technician
Member of Market Technicians Association
Master Rated Technical Analyst for Decisions Unlimited, Inc.
Instructor and Developer of TechniTrader® Stock Market Courses

©Copyright 2014 Decisions Unlimited, Inc. All Rights Reserved.
TechniTrader is the Registered Trademark of Decisions Unlimited, Inc.

Disclaimer: All statements, whether expressed verbally or in writing are the opinions of TechniTrader its instructors and or employees, and are not to be construed as anything more than an opinion. Student/subscribers are responsible for making their own choices and decisions regarding all purchases or sales of stocks or issues. At no time is any stock or issue on any list written or sent to a student/subscriber by TechniTrader and its employees to be construed as a recommendation to buy or sell any stock or issue. TechniTrader is not a broker or an investment advisor; it is strictly an educational service.

Thursday, June 5, 2014

$CSCO: How to Interpret Island Gaps By Martha Stokes CMT

Island Gaps are uniquely different from common, breakaway, or running gaps. Most common gaps fill quickly. Breakaway gaps rarely fill, and running gaps are often huge.

The Island Gaps do fill, but the time it takes to fill the gap can be several weeks to months.

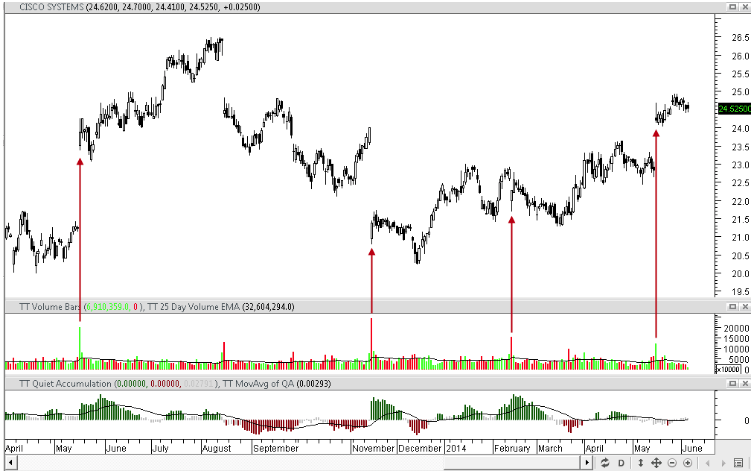
CSCO has had many island gaps form recently. Most of the gaps were caused by High Frequency Trading or HFT pre-market orders that filled the queues before the market opened, forcing market makers to set a higher or lower price for the stock at open.

Below is the original chart with arrows to show when HFTs caused the gaps. In the second chart, the islands are circled so that you can see them more easily. Not every island gap was caused by HFTs. Some were simply overnight order flow that drove price up or down before the market opened. Some are due to overseas markets’ prices that were lower or higher than the US market and so the stock price was adjusted before the market opened to the price that the stock was trading at overseas. This is done regularly to make sure all prices of stocks are the same around the world. Otherwise, if CSCO was trading lower in, say, Europe and opened higher in the US, that would create an arbitrage situation that could be exploited by many traders selling the stock in two different markets.


Island gaps reflect retail reactions to news events.  Often when the retail side of the market is unaware of a problem with the company, when the news is released, HFT orders trigger huge numbers of sell orders which cause the stock to gap down due to adjustments made by market makers in response to the imbalance of sell and buy orders. Whenever there is a huge imbalance between buy and sell orders, the risk of a gap rises.

This is why it is not a good idea to use news to buy or sell stocks, and why you should not be using a recommendation service or analyst advisories. By the time you get the news, the HFTs have already moved price, often substantially, and all you are doing is chasing that stock which results too often in a loss for the retail trader.

Gaps are common nowadays due to the market structure and how news is used by HFTs. You can take advantage of HFTs IF you learn how to analyze price action before the stock gaps so you are entering before the HFTs instead of after.


If you study the chart, you will see that once a gap down or gap up occurred, the price action did not move much, and it often reversed from the gap price for a few days.

To have a profitable trade, the entry must be made prior to the gap. If you wish to learn to trade gaps, first you need to understand why, when, and how they form. Some stocks, like CSCO, gap frequently and patterns reveal the risk of a gap. Entering after a gap usually poses a higher risk of a whipsaw as profit-taking often occurs over the next couple of days.

Watch a Video on Candlestick Analysis.

Trade wisely,

Martha Stokes CMT
www.MarthaStokes.com

Chartered Market Technician
Member of Market Technicians Association
Master Rated Technical Analyst for Decisions Unlimited, Inc.
Instructor and Developer of TechniTrader® Stock Market Courses
Metastock® Partner

©copyright 2014 Decisions Unlimited, Inc. All Rights Reserved.
TechniTrader is the Registered Trademark of Decisions Unlimited, Inc.

Disclaimer: All statements, whether expressed verbally or in writing are the opinions of TechniTrader its instructors and or employees, and are not to be construed as anything more than an opinion. Student/subscribers are responsible for making their own choices and decisions regarding all purchases or sales of stocks or issues. At no time is any stock or issue on any list written or sent to a student/subscriber by TechniTrader and its employees to be construed as a recommendation to buy or sell any stock or issue. TechniTrader is not a broker or an investment advisor; it is strictly an educational service.

Friday, May 30, 2014

Weekly Stock Review: $IDCC

Understanding Support and Resistance for Position Trading IDCC
By Martha Stokes CMT
IDCC recently formed a “compression” pattern. This is a new candlestick pattern where a group of candles indicate that the stock is poised for a sudden move, often a breakaway gap as occurred for IDCC.
The compression pattern is one of the most reliable and lowest risk entries for the automated market.

The entry was before the breakaway gap. As you can see, the stock gapped just above the highest high of the sideways pattern.  As the stock position is held, it is imperative to study the support and resistance levels to determine where it will stall, the risk of a retracement, and where it may encounter heavy profit-taking.
Two factors affect support and resistance levels:
  1. Technical traders
  2. Fundamental traders
Both have distinctly different areas where they buy or sell.  The strength of support or resistance is relevant to these two very different types of professionals.  Technical Traders are using pure technical chart patterns, often foolishly assuming they can predict a stock action rather than learning to anticipate price action—there is a huge difference.  
Fundamental traders, on the other hand, are using pure company analytics as they project the company profits and stock value correlations. They are thinking very differently.
Below are the primary resistance levels for IDCC.

The resistance that was recently broken through must be confirmed with another tight sideways pattern.  If it doesn’t move sideways and provide a stable horizontal support, then the stock will retrace or correct as short term profit-taking technical traders react to the price patterns.
The next line up is the area where the sideways action should form and is moderate resistance at this time. The 3rd line up is where fundamentalists will react, as this is a yearly high.
Each level of resistance will convert to a support level once the current price moves above it; however, if a resistance level is moderate, the support it provides is not necessarily moderate once the stock has overcome that resistance.
Right now, the stock has moved above and into the moderate resistance area on a daily chart. But the support that that same level provides is weak-moderate support until the stock has formed the next platform, aka sideways pattern.
Not fully understanding the relationship between sideways support and resistance is a common mistake that most traders make. They see the breakaway gap but do not properly evaluate how the stock will react to nearby resistance and how that resistance will affect the current support from the most recent sideways action below that price move.
This is due to the fact that most traders totally forget about the most important traders in the market, the fundamental traders. These are longer term institutional investors of many sizes with varying intentions for the stock.
Technical traders often do not consider how, when, where, and why the fundamentalists are moving into or out of a stock, nor do they consider the fundamentalist resistance and support levels.
Most Dark Pool activity is invisible to technical traders because they do not know what they should be looking for on the charts.  Dark Pool activity is in the stock chart, but it is not what most technical traders expect it to look like.
Learning to read stock charts is more than just finding a candlestick pattern. It is really being able to understand the language of candlesticks. For many retail traders, pure price action is gibberish so they depend too much on price and time indicators, a big mistake if you intend to be consistently profitable with better income than you can make on an hourly wage.
Summary:
There are two factors to studying, analyzing, and interpreting how price will behave at various support and resistance levels.  There are both technical and fundamental traders trading IDCC at this time.  How each approaches their preferred analysis will affect how the stock moves when it approaches resistance levels and how the stock will react when profit-taking or accumulation occurs.
As technical traders, understanding the fundamentalist mindset can dramatically improve your trading for day, swing, and position trades.  Fundamentalists dominate the market, so how, what, when, and why they are buying or selling matters.
For more on Position Trading Techniques: CLICK HERE
Trade wisely,

Martha Stokes CMT

Chartered Market Technician
Member of Market Technicians Association
Master Rated Technical Analyst for Decisions Unlimited, Inc.
Instructor and Developer of TechniTrader® Stock Market Courses

Charts courtesy of MetaStock®.

©copyright 2014 Decisions Unlimited, Inc. All Rights Reserved.
TechniTrader is the Registered Trademark of Decisions Unlimited, Inc.

Disclaimer: All statements, whether expressed verbally or in writing are the opinions of TechniTrader its instructors and or employees, and are not to be construed as anything more than an opinion. Student/subscribers are responsible for making their own choices and decisions regarding all purchases or sales of stocks or issues. At no time is any stock or issue on any list written or sent to a student/subscriber by TechniTrader and its employees to be construed as a recommendation to buy or sell any stock or issue. TechniTrader is not a broker or an investment advisor; it is strictly an educational service.

Tuesday, May 27, 2014

Employee Spotlight: William G

Name: William G.
Time with Company: 18 years
Area of company works in: Support / Documentation / Product Development / Quality Assurance
Do you trade in your spare time: No
Favorite part of your job: creating formulas and add-ons
Favorite Quote: “The only true failure is the failure of not trying.”
Favorite Color:  No single color but prefers deep rich hues (i.e.: maroon, navy blue, Sherwood green)
If you weren't working with MetaStock what would you want to be doing: creating/building something.

Friday, May 23, 2014

TechniTrader Weekly Stock Review for MetaStock Users - SYMC: Dark Pools at the Bottom

One of the most difficult things for traders to do is to determine when a bottom has started after a correction is underway.  Many times, traders are still attempting to sell short when the giant lots that use Dark Pools for their orders start to move into a stock to commence the bottom.


Nowadays, true bottoms are started by Dark Pools as these giant-lot investors move in quietly, unnoticed by the intraday, HFT, and retail trader. Their buying power is unmatched by all other market participants.


Although these large lots are invisible on the exchanges, ECNs, and retail broker systems during the trading day, every order for every stock is required by law to be cleared through the national clearing houses.  This data is then sold to Data Feed Providers such as BATS or Reuters or MorningStar, who then sell this collected, consolidated data to other vendors, market participant groups, etc. That means that your End-of-Day charts contain the Dark Pool activity.


Their footprint is there to see on the charts IF you learn what you are looking for.


Dark Pool Footprints: Your Advantage Over HFTs


SYMC has the classic pattern called “Shift of Sentiment.”  First, there is the huge volume spike to the downside with a huge gap down pattern on high red TT Quiet Accumulation bars.  This usually precedes the Dark Pool entries.


Dark Pools use special orders that control the buy zone for their large lot activity.  HFTs are unaware that the Dark Pools are quietly accumulating and continue to sell short for a period of time. HFTs are not human traders but are algorithms that run via a computer, sending orders to the exchanges at millisecond speeds.

Often the HFTs are on the opposite side of the trade at a bottom.  The HFT has to change the algorithm to an upside trigger action once the computer recognizes or identifies the giant lot orders of the Dark Pools.


Most retail traders use MACD, Stochastic, or Bollinger Bands® as their primary indicator.  Unfortunately, NONE of these indicators reveal the Dark Pool quiet accumulation that creates bottoms.  With these indicators, false upside entry signals and false sell short entry signals occur frequently as HFT selling collides with Dark Pool Accumulation as the bottom commences.


Below, MACD shows a buy signal crossover after an engulfing white (aka bullish engulfing) just before the final low. But unfortunately, the MACD crossover signal is a false entry pattern and the stock gaps down the next day. In fact, MACD lags behind price often on this chart. And it doesn’t tell you where the Dark Pools are buying or if HFT action is in control of price. If you had used MACD or its trading system that gives red light/ green light signals, you would have been whipsawed out of SYMC many times at a small to large loss. Decades ago, MACD was an amazing indicator, but now it fails more and more often.

Bollinger Bands compressed at this time, but this indicator alone doesn’t tell you the direction the stock will take next.


In the chart below, later in the bottom development that TT Quiet Accumulation identifies clearly, Bollinger Bands are compressing to indicate a breakout pattern is imminent; however, Bollinger Bands do not indicate what direction the stock will take, or the momentum or lack of momentum behind the imminent breakout.  MACD is neutral, telling you nothing about this imminent breakout.  Both indicators lack essential data you need to know in order to determine what the stock’s price will do next because their formulas use only price data.


Hybrid indicators reveal far more information about who is in control of price AND the direction the stock will take out of sideways patterns such as bottoms.

Summary:  

If you really like the popular price indicators like MACD, Bollinger Bands or Stochastic, then consider adding a leading hybrid indicator such as TT Quiet Accumulation. Otherwise, your indicator analysis will lack the critical information you need to succeed in today’s new market structure where Dark Pools and HFTs control price much of the time.

To be successful in trading today’s stock market structure that has multiple venues, speeds of execution, and vast differences in lot size, investment funds, and specialized orders for each market participant group, you must adapt and use indicators that will reveal the patterns of the most influential market participants.

Without leading hybrid indicators written specifically for the current market conditions where giant lots can move quietly in and out of stocks without disturbing price, you cannot attain the high profits of those traders who are able to detect a bottom early with the correct indicators for doing so.


Trade wisely,
Martha Stokes CMT

Chartered Market Technician
Member of Market Technicians Association
Master Rated Technical Analyst for Decisions Unlimited, Inc.
Instructor and Developer of TechniTrader® Stock Market Courses

Charts courtesy of MetaStock®

©copyright 2014 Decisions Unlimited, Inc. All Rights Reserved.
TechniTrader is the Registered Trademark of Decisions Unlimited, Inc.

Disclaimer: All statements, whether expressed verbally or in writing are the opinions of TechniTrader its instructors and or employees, and are not to be construed as anything more than an opinion. Student/subscribers are responsible for making their own choices and decisions regarding all purchases or sales of stocks or issues. At no time is any stock or issue on any list written or sent to a student/subscriber by TechniTrader and its employees to be construed as a recommendation to buy or sell any stock or issue. TechniTrader is not a broker or an investment advisor; it is strictly an educational service.


Friday, May 16, 2014

Technitrader Weekly Stock Review: Volume Patterns on VAC


This week, let’s study colored Volume Bars and how to avoid whipsaw trade risk by understanding how volume and volume-based indicators reveal the weakness in a candlestick pattern.


Many traders still rely upon price and price indicators solely, which leaves them highly vulnerable to whipsaw action.  Volume is critical in today’s automated marketplace where 80% of all orders are processed automatically via a computer program set to fill large orders over time without moving price.


On the VAC chart below, the current day is an Engulfing White (aka Bullish Engulfing) candlestick pattern, which is commonly used for entries.  Prior to that candle forming, the stock had two reversal candle patterns where sellers attempted to sell the stock down, but buyers moved in, triggered by the support from the highs of late December.  This is a technical bounce area for this stock.  Professional technical traders are active at this time, and some retail traders may also be in the stock.   This is not a fundamental support level and there is no Dark Pool Footprint, which is a very distinct price and accumulation pattern.


On the day of the Engulfing White, volume is dropping below its moving average.  This is a warning that this stock lacks sufficient buyers.  In addition, TT Quiet Accumulation is showing a red bar as price moves up, which is a divergence pattern indicating a giant or large lot fund is rotating slowly and carefully out of this stock without affecting the price. The Large lots are selling while smaller lots are buying.  This weighs the balance of power to the downside.


In early March in the chart above, a common gap up to a long white candle with an extraordinarily long volume bar is the footprint of High Frequency Trading orders.  The stock did not move up strongly after that HFT action because volume was weaker.


The next day, the stock forms an indecision candle pattern, as seen in the chart below, rising slightly above the previous high and settling back to the close with much lower volume.


The next day, in the chart below, the stock moves up about 1 point on rising volume but with more rotation showing in Red TTQA. The stock moves up to the weak resistance level and pulls back before the close of the day. Volume is still below its average.


At this point, the retail trader has less than one point gain, which is insufficient for a swing trader to be profitable when all the costs of the transaction, time, fees, etc. are factored in.   However, since the stock moved up, greed settles in.  Most swing traders would hold, unaware that volume is insufficient to drive price up, that the resistance just above is more substantial than it appears due to the weaker volume AND due to the sell side pressure of larger funds rotating out as price moves up.  But most retail swing traders would be excited and would choose to hold.


Here is what happened next: The first small black candle in the chart below wipes out half of the tiny profit. This tends to make retail traders try to hold, hoping the next day the stock will move up again as it did before.  Sure enough, the stock opens at the prior close but then falls further that day. The following black candle wipes out all the remaining profits.  Most swing traders trade runs for 2-10 days.  But look at volume. Red Volume is rising. The larger lots are taking control as fewer small lot buyers are moving in.  The following day is a huge down day with a 2-point loss. Exiting the following day either means a 3-point loss or contains the loss to about 2 points. The risk to reward ratio was inverted, the large lots were selling into the bounce, and smaller lot traders had a whipsaw trade.


This is why most retail traders have chronic losses with intermittent profitable trades.  Volume and volume-based indicators are critical. Not using volume means you have no idea which side of the transaction the larger lots are trading.


Some retail traders would argue that they would have gotten out of the trade on the first day, or the second day, but in reality most do not.  Also, if you are taking 25 cents off the table and thinking you are profitable, think again.  With fees, costs, and your TIME, you are losing money or breaking even.  How much is your time worth?  Minimum wage?  Calculate the time you are spending including your time going to seminars, webinars, and searching the internet for answers. Then, add it all up.  Most retail traders are losing money by setting their profit expectations too low.  


For information on Volume Indicators that lead price action: CLICK HERE


Trade wisely,
Martha Stokes CMT
Chartered Market Technician, Member of Market Technicians Association
Master Rated Technical Analyst for Decisions Unlimited, Inc.
Instructor and Developer of TechniTrader® Stock Market Courses
Metastock® Partner


© 2014 Decisions Unlimited, Inc. DBA TechniTrader®. All Rights Reserved.

Disclaimer: All statements, whether expressed verbally or in writing are the opinions of TechniTrader its instructors and or employees, and are not to be construed as anything more than an opinion. Student/subscribers are responsible for making their own choices and decisions regarding all purchases or sales of stocks or issues. At no time is any stock or issue on any list written or sent to a student/subscriber by TechniTrader and its employees to be construed as a recommendation to buy or sell any stock or issue. TechniTrader is not a broker or an investment advisor; it is strictly an educational service.

Tuesday, May 13, 2014

"ETS 2.1" - One of My Favorite Trading Systems

There are literally thousands of trading systems and methodologies out there.   It can be challenging to know which ones would be a good fit for your trading style.  It’s always a good idea to have multiple indicators or systems that complement each other, rather than rely on one single signal.  Getting “agreement” from several systems can bolster confidence in your positions, and give you greater clarity.  One system I have found to be particularly useful as a confirming call is the “ETS 2.1 Trading System”. 

ETS, developed by Michael Mermer, is a trend-based system, and has been highly rated from many sources.  In fact, Futures Magazine rated it as one of the “Top Ten trading systems of all time”.   On the developer’s website;  traderssoftware.com, they boast some impressive calls in market direction, including a chart that shows how ETS called a clear “Sell” signal before the “Flash Crash”.     ETS is also quite versatile.   It works on a variety of instruments, including stocks, futures, indices and forex, and performs well for both daily and intraday charts.   Personally, I like to use the Expert Advisor and Expert Commentary to help confirm a position and set profit targets.   However, the best reason to have the ETS 2.1 system is that it is so easy to use!   Here are a few examples:


Here you can quickly see the ETS buy and sell signals on a chart of the S&P 500.  The commentary window shows the suggested stops, and profit targets for the buy signal in September of 2013.  At the bottom of the chart you have the ETS Trendwatch indicator that gives you a good way identify the overall market trend.    The Trendwatch  indicator also merges nicely into any template with your other trend-based systems.

Here is the ETS template on the Nasdaq 100 using 30 minuet bars.  Again, it does a great job spotting the trend quickly, and confirms it with the Trendwatch oscillator.    With its automatic and logical stops, it quickly gives you starting point to keep your trading efficient.  ETS keeps you in the trade throughout the trend.

Here is one more example using the ETS on light crude (continuous).  You can see the initial profit target (107.63) as shown touching the upper horizontal line.  This obviously worked out to be a great exit point, even though the price continued to reach higher over the next few weeks.  If you had "held on" longer, you would have crossed below the 21-day moving average, and ridden through a zone of sideways price action, until ultimately getting a Sell signal a few weeks earlier.  This is a great example of the intuitive the profit targets in ETS.

Altogether the ETS add-on system includes an Expert, two Explorations, two Templates and five System Tests.  There are optimizations available as well.   ETS is a proven system and its one that I am glad to have in my trading tool set.  This is one add-on that every MetaStock user should at least try.  I think you will find it useful in confirming your positions and making you a more efficient trend trader.