Thursday, August 7, 2014

Candlestick Charts: Beyond the Basics


Learn How to Interpret Candlestick Patterns for Optimal Trades

By Martha Stokes CMT

Today’s chart is Disney (NYSE: DIS) for learning how to read and interpret candlesticks beyond the basics of what is taught in candlestick books and articles on the Internet.

There is a whole world of information in the candlestick patterns which most technical traders never learn, and therefore never use. Since analysis of price action is vital to the success of a technical trader, reading candlesticks beyond the basics of a specific candlestick pattern or a continuation or reversal pattern is essential if technical traders expect to earn the income of a professional trader.

DIS is an excellent example of why technical traders need to be able to read the chart for both the upside and downside price action. This stock is showing weakness in the candles, which the trend itself and the basic candle patterns do not reveal.


It is always important to not only study the price and time aspects of a chart, but also the quantity values as well. The 3 pieces of data available for a stock chart are PRICE, TIME, AND QUANTITY. Always incorporate quantity in the candlestick analysis, as this makes the interpretation complete and reliable. Without quantity with candlestick patterns, half of the most critical data for evaluation is missing.

The first correction, which started in late February, did not have any High Frequency Trading (HFT) action selling down, yet the black candles are long and volume is consistent through this correction, which ended in the middle of May. Checking the volume, price, and Volume Accumulation indicators, it is obvious that this is large-lot rotation quietly selling out of DIS during that period of time. YES, the stock continues further up, but the candlesticks are inconsistent runs, weaker volume, and smaller candles.

As the stock ran up in June, volume bars on up days are below average, a huge red flag that this run up is weak. It corrects and then resumes upward, this time on HFT volume, but no gap or big run up, even with heavy HFT volume. This tells technical traders that there is underlying selling pressure which has continued, even while smaller lots have driven price upward. The large lots are selling as the stock rises on smaller-lot speculative buying.

DIS is now in a sideways pattern at a new, an all-time high, and it continues to show larger-lot sell days on the candlesticks with weaker, smaller white candles on up days. The volume is now well below the average for this stock, and the candles that formed in July are also very weak. Many traders might be tempted to buy this stock at this level on a white candle; however, the candlesticks with volume and Volume Accumulation clearly show that the large lots are on the sell side.

Learn Effective Candlestick Analysis HERE.

Trade Wisely,

Martha Stokes CMT

Master Rated Technical Analyst: Decisions Unlimited, Inc.
Instructor & Developer of TechniTrader Stock Market Courses

© 2014 Decisions Unlimited, Inc. DBA TechniTrader®. All rights reserved.

Disclaimer: All statements are the opinions of TechniTrader, its instructors and/or employees, and are not to be construed as anything more than an opinion. TechniTrader is not a broker or an investment advisor; it is strictly an educational service. There is risk in trading financial assets and derivatives. Due diligence is required for any investment. It should not be assumed that the methods or techniques presented cannot result in losses. Examples presented are for educational purposes only.

Friday, August 1, 2014

Intermediate-Term Bottom Formation Analysis


Is COST Completing Its Bottom, Or Is There More Downside Coming?

By Martha Stokes CMT


Costco Wholesale Corp. (NASDAQ: COST) started an intermediate-term correction in December 2013, after a strong 4-year moderate uptrend that had brief short-term corrections which helped sustain the trend technically. So far, most of 2014 has been a downtrend for COST.


Technical traders need to start studying the stock now, as it begins to show signs of improvement. Here are the key patterns that help identify a bottom formation underway:


The weekly chart below shows the correction from December 2013 to summer 2014 and the steady rise of the stock as it begins its bottom formation.


The daily chart has far more detail and helps technical traders recognize that this is a bottom underway. One huge factor is the fact that the lows have been rising, so higher lows have formed since April 2014 and the price action has become more consistent and is currently starting to compress just below the bottom completion resistance level.


The bottom completion resistance level tends to be strong resistance, shown on the chart below as a black horizontal line. This is the level from which the final capitulation by smaller lots started. Later, there is an attempt by High Frequency Traders to sell the stock down further on March 6, 2014, but it failed. HFTs are usually followed by the small funds and retail groups. The fact that the stock was sold down by these groups, but failed to break down below the prior low of February, indicates that there is some light quiet accumulation going on that kept the stock from dropping below the prior lowest low.


This is usually how bottoms begin to develop—as HFTs, small funds, and retail fail to trigger another strong move down due  to quiet accumulation, which holds the stock above the prior low.


This bottom is called a “bowl shape.” If you drew a line along the lows starting at the resistance level line, it would have a rounded shape from December to current. Bottoms that are shaped similar to a bowl tend to be very reliable bottoms. However, as it tests the resistance level, it is likely to retrace back down to weak support again before gaining sufficient energy and strength to break out above the bottoming resistance level.


COST's all-time high was about $126.00, so it is currently about 10 points from its all-time high. This is a consideration for position traders who use target-gain potential as part of the reward to risk analysis.


Learn more about candlestick pattern analysis HERE.


Trade Wisely,


Martha Stokes CMT


Master Rated Technical Analyst: Decisions Unlimited, Inc.
Instructor & Developer of TechniTrader Stock Market Courses
TechniTrader is a MetaStock® partner


© 2014 Decisions Unlimited, Inc. DBA TechniTrader®. All rights reserved.


Disclaimer: All statements are the opinions of TechniTrader, its instructors, and/or employees, and are not to be construed as anything more than an opinion. TechniTrader is not a broker or an investment advisor; it is strictly an educational service. There is risk in trading financial assets and derivatives. Due diligence is required for any investment. It should not be assumed that the methods or techniques presented cannot result in losses. Examples presented are for educational purposes only.

Friday, July 25, 2014

How Regression Lines Show Weakening Stock Price Patterns


Micron Technology (NASDAQ:MU) – Regression Line Analysis
By Martha Stokes CMT

Choosing the right indicators for trading is often a daunting task for many new and beginning traders. There are over 200 stock and index indicators to select from and many charting programs have long lists with minimal instructions on how to set the time periods, when to use the indicator, what it was intended to indicate, and whether it is for short-term trading or long-term analysis.

Swing traders should be using different indicators and period settings than what a position trader would use. Swing traders depend upon momentum for short-term price action that they ride up for a few days. Position traders use the slower sideways price pattern called a platform to enter at a lower risk level and then allow the stock to move up over several weeks to months, earning higher profits with lower risk.

If a swing trader is using the wrong indicators, and most technical swing traders use the wrong indicators, then their profitability diminishes substantially.

One indicator that is useful in assessing whether a stock is still trending up or has shifted to a sideways pattern, before it is clearly evident in price action, is the Linear Regression Lines. These are straight lines that are based on the current close or last price to X number of periods ago.

By using a short Regression Line over a Longer regression Line, technical traders can see several important aspects of a stock’s price action that are not easily seen using moving averages or other common indicators.

Patterns that Linear Regression Lines show:

  1. The angle of ascent or descent of the intermediate-term trend.
  2. The angle of ascent or descent of the short-term trend.
  3. Whether or not the short-term trend or intermediate-term trend is moving at a steeper angle.
  4. Whether the two trends are angling up similarly or diverging.
  5. Converging and diverging patterns indicating that one trend has shifted over the other.

In the MU stock chart below:

The Regression Lines show that the short-term trend is moving more slowly than the intermediate-term trend. In other words, the short-term trend is sideways whereas the intermediate-term trend is still technically trending upward. The angle of ascent for the intermediate-term trend has become too steep to sustain. This means that the short-term trend is starting to pattern out the excessive speculation in the stock’s price by slowing down its ascent and moving in a sideways platforming pattern. This is a very common pattern that is often missed by swing traders and position traders.

Unfortunately, if a swing trader attempted to trade this stock on a swing trade, the result would be a whipsaw trade that might result in a loss after all expenses were considered. The runs are weak and do not sustain adequately for a strong momentum run during this platforming phase. Retracements occur frequently but do not move the price down sufficiently for selling short either. The sideways pattern is too tight for swing trading.

Mu Chart

Summary:

There are many different types of indicators a technical trader can use. Selecting the right indicators that will help you become a more profitable trader can be a daunting task. What is most important to remember about choosing indicators is:

The most popular indicators are the ones that are used in high-frequency trading, HFT, technical algorithms that are searching for cluster order flow from retail traders.

The HFT order triggers on the millisecond and can front-run traders who are using trading systems or technical stock indicators that are overused and very popular. In addition, many of the popular indicators were written decades ago, for an entirely different stock market structure and are no longer as useful as they once were. Traders need to consider using the modern leading indicators, hybrid indicators, and large-lot indicators that can reveal where Dark Pool buying or selling is occurring. By using modern indicators, a retail trader can dramatically improve their profitability.

For more on modern indicators for today’s market, CLICK HERE.

Trade Wisely,

Martha Stokes CMT

Chartered Market Technician
Master Rated Technical Analyst: Decisions Unlimited, Inc.
Instructor & Developer of TechniTrader Stock Market Courses
MetaStock® Partner

© 2014 TechniTrader®. All rights reserved.

Disclaimer: All statements are the opinions of TechniTrader, its instructors and/or employees, and are not to be construed as anything more than an opinion. TechniTrader is not a broker or an investment advisor; it is strictly an educational service. There is risk in trading financial assets and derivatives. Due diligence is required for any investment. It should not be assumed that the methods or techniques presented cannot result in losses. Examples presented are for educational purposes only.

Wednesday, July 23, 2014

Is the Dow still in an uptrend?

So here we are in July, 2014.  I just got back from a trade show in Australia where I enjoyed hearing some interesting market theory.  I love to open up the XENITH platform and look at some of the more common economic indicators in the market and see what the data looks like.

What is the state of the economy?

Unemployment in the US is declining:


Housing prices are increasing steadily.


For all intents the US economy seems to be strong.

However, when it comes to trading I like to keep it as simple as possible.

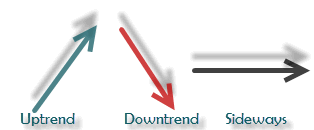
For this I like to use Dave Landry's pattern identification tool.  I've found it to be pure genius in identifying what type of a trend the market is in.  In fact, I've taken the liberty of "borrowing" a copy to share (I don't think Dave would mind).  Here's how Dave likes to identify a trend:


So keeping the Landry method of simplicity in mind,  I'd say this chart of the DIA should help you identify the trend you are in.


Trade with the trend.

As a matter of full disclosure, I currently hold a position in the DIA myself.

Tuesday, July 22, 2014

Employee Spotlight: Lee H

Name: Lee H.
Time with Company: 1998 to present
Area of Company: Software Development
Do you trade in your spare time: Off and on.
Favorite part of your job: Making the software easier to use for our customers.
Favorite Quote: No other success can compensate for failure in the home.
Favorite Color: I'm partially color blind - I worry that my favorite is one of the colors I can't see.
If you weren't working with MetaStock what would you want to be doing: Writing flight simulation software


Monday, July 21, 2014

Weekly Stock Review: Topping Action in SNDK

How to Identify a Topping Action Before the Correction Starts
By Martha Stokes CMT

The technical trader needs to be able to see the increasing risk of a top formation in a stock prior to the top in order to avoid buying late and having whipsaw trades due to entering on weaker buying volumes as giant lots begin rotating to lower their risk due to over-speculative pricing.

Sandisk Corp, SNDK, is a stock that has been running up with a runaway trendline pattern that has had profit-taking retracements that have not adequately patterned out the speculative nature of the buyers. Unfortunately, such runs, which are wonderful for technical traders who entered early, eventually end, and often abruptly.

SNDK has been a superb stock for position traders since it started building platforms back in 2013. Platforms develop as giant- and large-lot institutions slowly accumulate a stock over time. Their controlled bracketed orders maintain buy zones that are not sufficiently wide enough for swing traders but are ideal for low-risk position trading. Position trading is the easiest of all the trading styles to learn and is far more lucrative than day trading.

The SNDK chart started out as a position-style platform-building stock that provided several levels of entry at low risk. The position trader is able to ride these up with minimal effort and time monitoring the trade, far less time than day or swing trading requires.

In May, the stock’s price action started moving with momentum energy, driving the price up vertically with too steep of an angle of ascent. Now as the stock reaches above $100, there is an increased risk of profit-taking by pro traders and rotation by some of the larger funds. Profit-taking puts this stock at higher risk of a correction due to the overly speculated price action.


The goal of this lesson is for technical traders to see the price trend shift from platforms to a momentum price pattern with an angle of ascent that was far too steep to sustain. Like an airplane, if stocks move too quickly and too steeply, the risk of a “stall” increases exponentially. The higher the stock climbs too quickly, the steeper the correction must be. Support for this stock is weak, so the risk of a deep correction is likely.

There are only two ways to correct and pattern out such extreme price action in a stock:

  1. The stock must correct back down to a prior moderate support level, around $80-84 on the SNDK chart.
  2. A wide sideways price action must develop, either a trading range or platform that lasts for many weeks or even months.

At this time, SNDK shows weaker candles, some quiet distribution in TechniTrader’s Volume Accumulation and Flow of Funds indicators, and more sell side volume than buy side volume. TTVA is declining in a negative divergence from the stock’s price trend, which is indicative of profit-taking even though price has not moved down yet. Remember that the institutions have special orders that can control price and do not move it much at all.

Summary:

Buying this stock at such an extreme pattern is a very high risk. Profit-taking has already started and the indicators are all diverging away from the stock’s price trend. Learning to identify a topping action, before the correction starts, can help the technical trader avoid whipsaw trades, weaker trades, and chronic losses.

Learn more about using stock price action to guide your trading decisions: CLICK HERE

Trade Wisely,

Martha Stokes CMT

Master Rated Technical Analyst: Decisions Unlimited, Inc.
Instructor & Developer of TechniTrader Stock Market Courses

© 2014 Decisions Unlimited, Inc. DBA TechniTrader®. All rights reserved.

Disclaimer: All statements are the opinions of TechniTrader, its instructors and/or employees, and are not to be construed as anything more than an opinion. TechniTrader is not a broker or an investment advisor; it is strictly an educational service. There is risk in trading financial assets and derivatives. Due diligence is required for any investment. It should not be assumed that the methods or techniques presented cannot result in losses. Examples presented are for educational purposes only.

Friday, July 11, 2014

TWTR: How to Interpret Bottoming Price Action


Tips on How to Identify Strong Bottom Formations before Completion

We had a strong summer rally due to the continued inflow of money from bonds into stocks. Also, there are far more Foreign and Sovereign Funds buying stocks than ever before; this created an unusual summer rally, far stronger than is normal.

Many stocks moved quickly from a short-term correction to a bottoming phase as Dark Pool giant-lot and large-lot institutions started buying stocks they identified as having strong fundamentals with bargain stock prices.

For example, Twitter (TWTR) is a stock that has excellent institutional ownership percentages for the age of this new IPO. The technical pattern that is most important for this stock’s chart (below) is what is called a “Shift of Sentiment” in TTQA.

The TechniTrader Quiet Accumulation indicator has a special formula that identifies whether the large lot triggered on the uptick or on the downtick, and this tells the technical trader whether Dark Pools are buying incrementally or selling.

In TWTR, the Dark Pools are buying, which caused the shift of sentiment from red TTQA, caused by High Frequency Trading (HFT) selling, to gray and green TTQA, which is caused by Dark Pools quietly accumulating, and this started the bottom formation.

In May, the final low is identified by the long black candle that gapped down with an HFT volume spike. This is followed by smaller funds selling due to the use of VWAP (volume weighted at price), which triggers on high volume.

Then, from late May to early June, Dark Pools halted the downtrend as they started buying the stock slowly over time with large-lot transactions. This caused TTQA to “ping” the uptick, which turned TTQA green.


Dark Pools are the primary reason a bottom forms at a specific price range. They leave distinct footprints on bottoms, which tell the technical trader that the bottom is a true bottom, and not just a temporary rebound or bounce up due to oversold conditions.

The giant institutional investors who use Dark Pools are the savviest and most experienced long-term investors in the market, and they also have extensive research and analytical departments that study every stock they are investing in, so it makes sense for retail traders and technical traders to follow the Dark Pool activity by learning to interpret accumulation/ distribution indicators such as TT Quiet Accumulation.

Learn to follow Dark Pool Activity in This Free Training Video.

Trade Wisely,

Martha Stokes CMT

Master Rated Technical Analyst: Decisions Unlimited, Inc.
Instructor & Developer of TechniTrader Stock Market Courses

© 2014 Decisions Unlimited, Inc. DBA TechniTrader®. All rights reserved.

Disclaimer: All statements are the opinions of TechniTrader, its instructors and/or employees, and are not to be construed as anything more than an opinion. TechniTrader is not a broker or an investment advisor; it is strictly an educational service. There is risk in trading financial assets and derivatives. Due diligence is required for any investment. It should not be assumed that the methods or techniques presented cannot result in losses. Examples presented are for educational purposes only.